| - provided by Danish Food Informatics |
Estimating Component Values - Dairy Products | |
| Updated 2019-11-01 | |
| Estimating Component Values for Cow's Milk Products |
![]()
Like for other foods, there are some clear biologically determined relations between core components in cow's milk. Lipid is one of the core components in the production of dairy products, and most dairy products are characterized by standardization of the content of the lipids. Based on the thorough analytical material produced by the Danish Dairy Research in the beginning of the 1980s and The Danish National Food Agency's Food Monitoring System for Nutrients from 1985 to 2005 of these relations will be decribed in the following.
| Danish Dairy Research |
The investigation of Laustsen and Jensen (1984) includes analysis (dry matter, fat, and protein) of fresh and cultured liquid milk products produced in Danish dairy plants representing about 90% of the total production of liquid milk products.
The number of samples was quite comprehensive with more than 3500
samples of fresh liquid milk products (n=1099, whole milk, semi skim
milk, skim milk, and creams), fresh liquid milk products with admixture
(n=184, mostly milk with sugar and cocoa added), cultured market milk products (n=
1205, buttermilk, youghurt naturel, crème fraiche), and cultured market
milk products with admixture (n= 1021, yoghurts with fruit).
Unfortunately, the single analytical values are no longer available.
The
investigation covered sampling all year sampling and included seasonal
variations, but for simplicity only the yearly average values have been
used in the following calculations.
| Protein and total lipids |
Statistical analysis of the traditionally standardized fresh (sweet) and cultured milk product
values (blue dots) show a linear fit (p<0.0001)
between the total lipid content and the protein content,
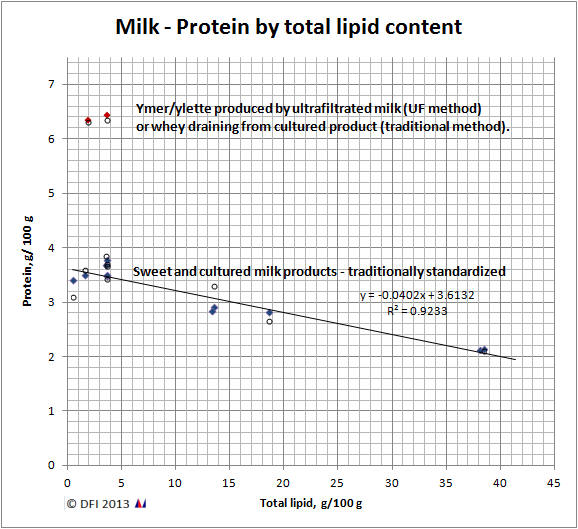
whereas the two cultured products (ymer/ylette) produced with utrafiltration or draining techniques do not follow the same simple fit due to their higher protein/dry matter content (red dots).
For the sweet and cultured milk products - except the ultrafiltrated/drained products - the linear fit is
protein [g/100 g] = 3.6132 - 0.0402 [g protein/g
total lipid] * total lipid
[g/100 g]
shown as the straight line in the figure above.
Adjusting the regression model to include the variable dry matter provides a fit that includes the two ultrafiltrated products.
There is a significant influence on the
protein value from total lipid (p<0.0001) and dry matter (p<0.0001).
The regression model including dry matter is
protein [g/100 g] = -5.838 + 1.028 [g protein/g dry matter] * dry matter [g/100 g] - 0.9622 [g protein/g total lipid] * total lipid [g/100 g]
which is valid for both the traditionally standardized and ultrafiltrated products in the survey. The resulting calculated protein values according to this model are shown in the figure above (in small circles).
| Vitamin A and E and total lipids |
In the series of investigations by Danish Dairy Research, Larsen et al (1985) analysed the contents of the fat soluble vitamins, A and E, β-carotene and the content of total lipid.
Both the vitamins in milk show a clear seasonal variation (high values summer/autumn and low values winter/spring). The variations are most visible for the high fat (cream) values.
The following models for the two
vitamins are based on the the yearly averages. Only drinking milk (total
lipid: 3.5 g/100 g and below) and whipping cream (total lipid: 38 g/100
g) was analysed.
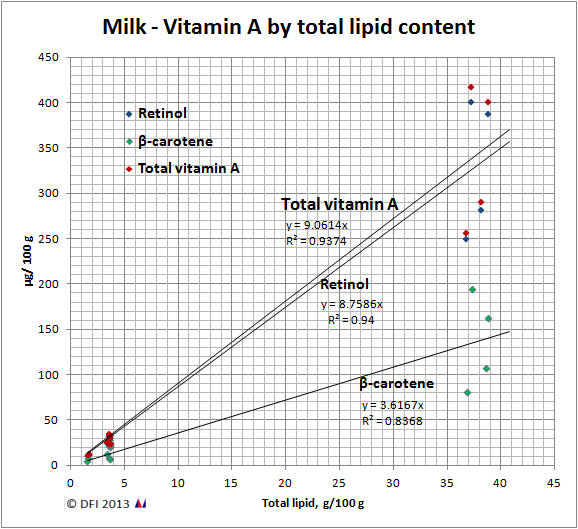
Total vitamin A, retinol and β-carotene content in milk follow the total lipid content
with a linear fit. Due to the nature of the data, not other relationship
is identifiable. The analysis has shown that the intercept is so close
to zero that it is presumed that the vitamin A and E components are only
present in the lipid phase of milk.
For the vitamin a components, the following relationships have been
identified
Vitamin A, total [RE] = 9.061 [μg/g total lipid] * total lipid [g/100 g]
Total vitamin A has been calculated on the basis of the retinol and β-carotene values, where the activity of β-carotene
is 1/12 of the activity of retinol.
The equations are for the yearly averages of retinol's dependence on total lipid
Retinol [μg/100 g] = 8.7586 [μg/g total lipid] * total lipid [g/100 g]
and for β-carotene and total lipid
β-carotene [μg/100 g] = 3.6167 [μg/g total lipid] * total lipid [g/100 g]
Vitamin E (α-tocopherol) shows the same summer/winter variations as vitamin A.
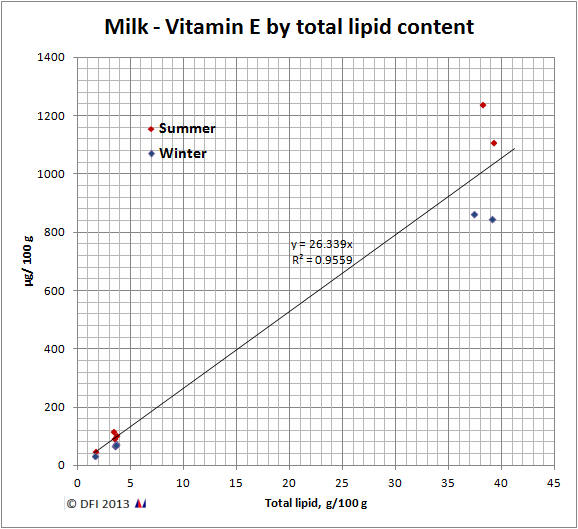
The equations for the yearly average of α-tocopherol's dependence on total lipid is
α-tocopherol [μg/100 g] = 26.3 [μg α-tocopherol/g total lipid] * total lipid [g/100 g]
| Food Monitoring System for Nutrients - National Food Agency of Denmark |
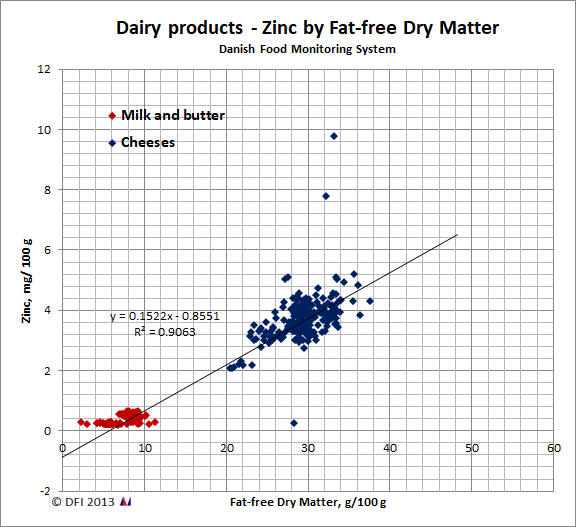
As part of the national food monitoring system, the National Food Agency and its regional laboratories analysed selected milk and milk products sampled in 1985, 1990, 1995 and 2000. A total of 785 samples of milk and milk products (555 samples of liquid milk and butter and 232 samples of brick and mould cheeses).
Depending on the sampling period, the liquid milk and cheeses were analysed for protein, total lipids, fatty acids, dry matter, ash, sodium, potassium, chloride, calcium, magnesium, iron, zinc, selenium, iodine, selenium, vitamin A (retinol), vitamins B1, B2, B6 and folates (only 1995). Butter was analysed for total lipids, fatty acids, dry matter, and vitamin A (retinol), and from 1995 also sodium, potassium and chloride.
The milk products sampled represent the most important liquid milk products in the Danish diet at the time. They cover whole and semi skimmed milk (and skim milk in 1985), and the cultured products, ymer and yoghurt naturel, all with a standardized fat content of about 3.5% and below, and whipping cream with a fat content of 38%. From a statistical point of view, it would have been interesting to have had samples of cream in the intermediate level of 10 to 20% fat, but this was not the purpose of the food monitoring.
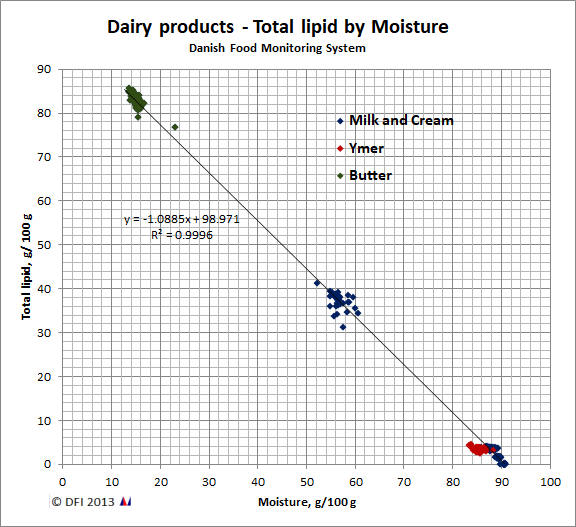
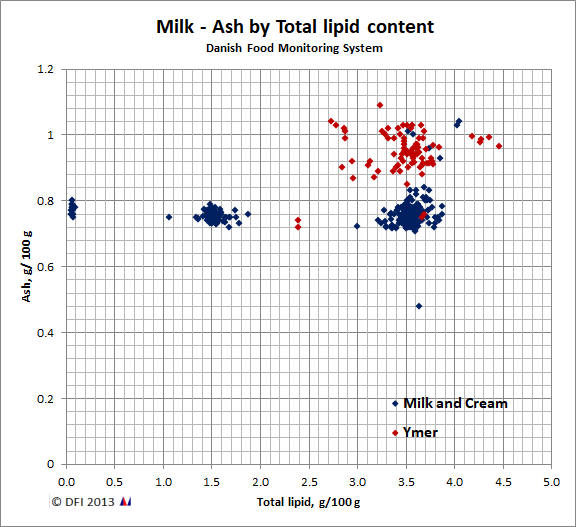
Some findings among the data from the Danish food monitoring system
is not surprisingly a completely linear relationship between moisture and
total lipid as well as no dependency of ash by total lipid (all
milk/butter data, 553 data points):
Similarly, minerals plotted against protein i dairy products from the
Danish Food Monitoring System:
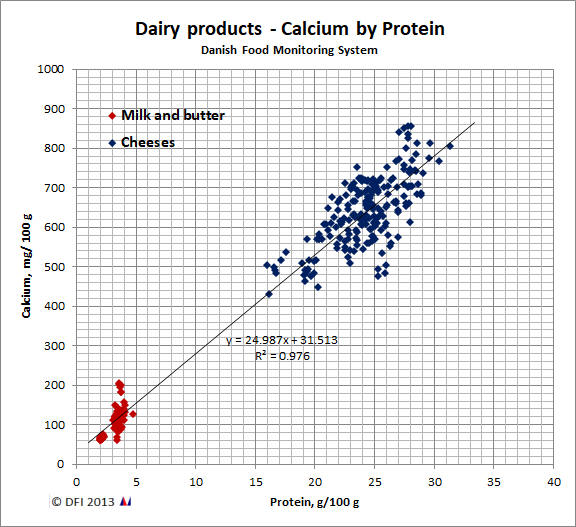
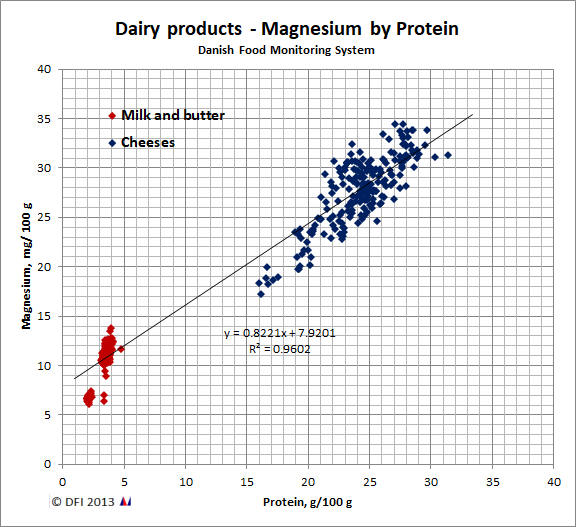
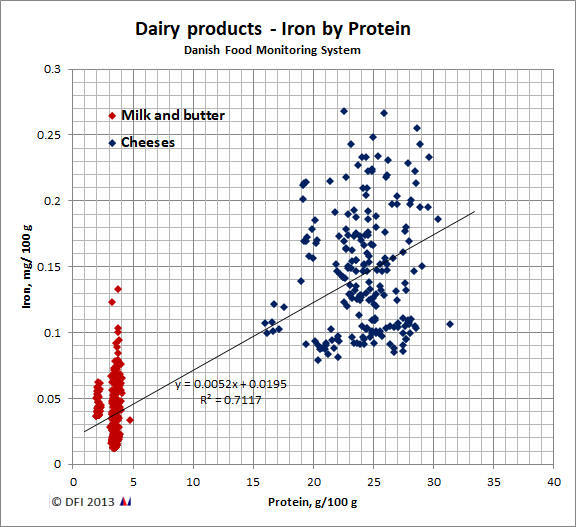
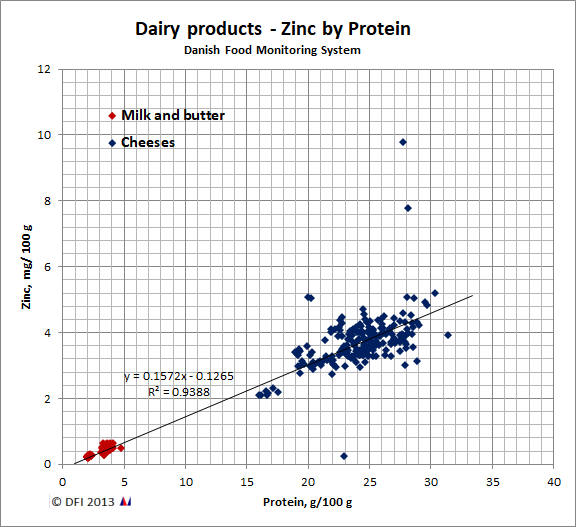
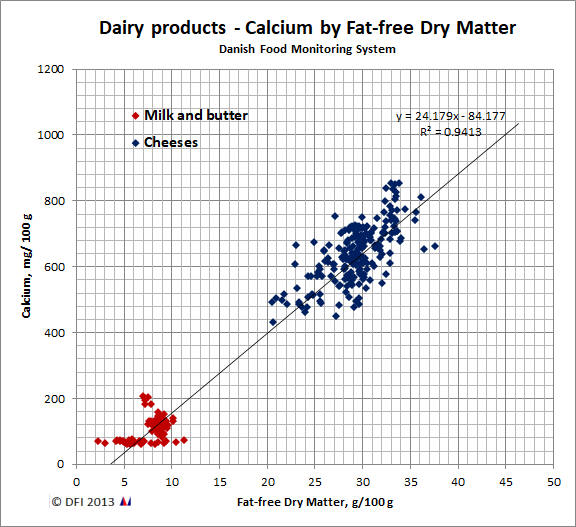
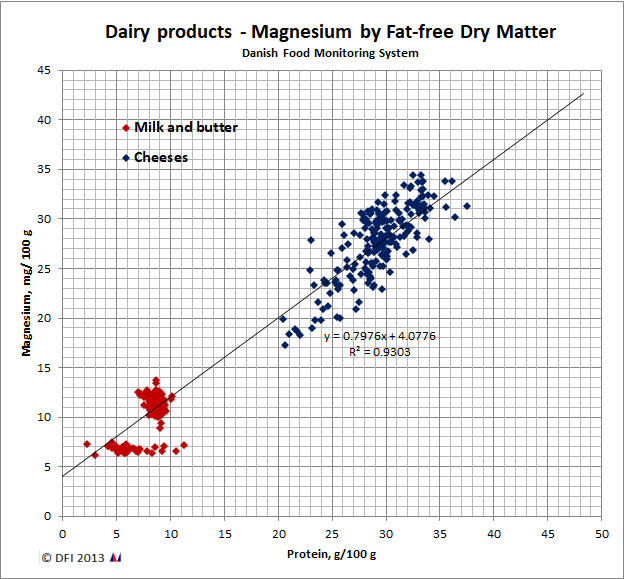
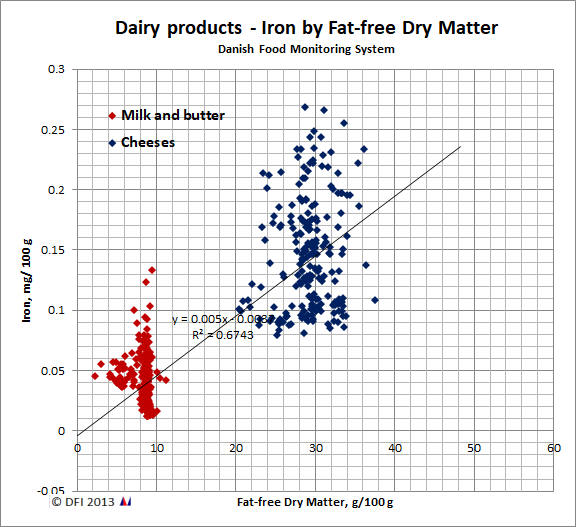
It is obvious that some of the minerals shows very weak
dependency on the protein content. A better measure may be fat-free dry
matter:
| Swedish Dairy Association |
Lindmark Månsson and colleagues have reported a very comprehensive material on the composition of raw milk (tank milk) sampled in 1996, 2001 and 2009.
| Calculating components in liquid milk based on the content in raw milk (tank milk) |
As mentioned elsewhere, the traditional processes in the dairy industry involve separation of the emulsified lipid phase from the aqueous phase with a following standardization to a specific lipid content in the final product. In theory, the components bound to or dissolved in the lipid phase will follow the lipids; similarly, the components in the aqueous phase will follow aqueous phase.
Therefore, simple mass balances can be used to calculate the content of
components in the final milk product provided that the distribution of
components between the lipid and aqueous phases is known and that
variability in their content is fairly stable in the raw milk.
This is the case in the data provided by Lindmark Månsson et al from the Swedish
Dairy Association and used as such by the National Food Administration
in Sweden.
In the report Näringsvärden i mjölk- och gräddprodukter,
Lindmark Månsson gives a detailed description of the calculation
procedures for nutrients in sweet milk products based on the
standardized content of milk lipid. The calculations are based on the
following assumptions concerning the vitamin loss during pasteurization
and the components distributions between the aqueous and lipid phases of
the raw milk:
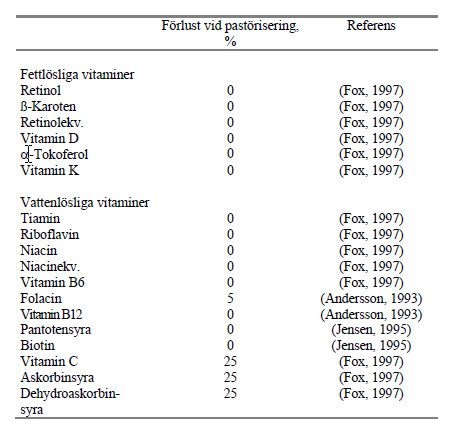
Nutrient losses during pasteurization of raw cow's milk from
Lindmark Månsson 1998.
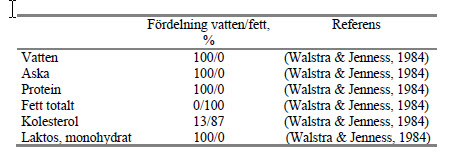
Distribution of major components between aqueous and lipid phases in
cow's milk from Lindmark Månsson 1998.
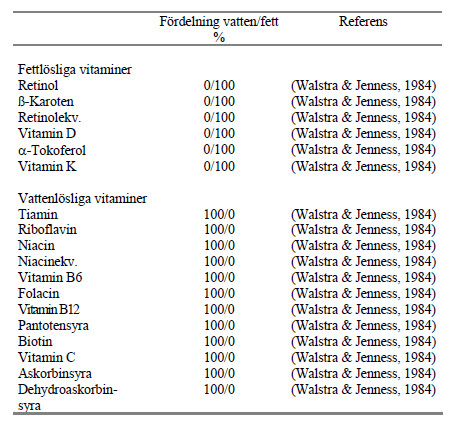
Distribution of vitamins between aqueous and lipid phases in cow's milk
from Lindmark Månsson 1998.
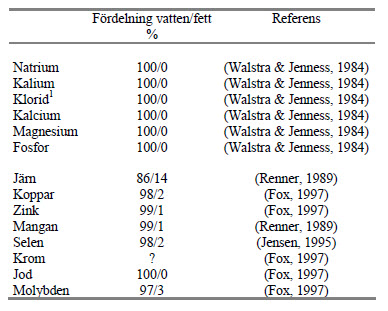
Distribution of minerals between aqueous and lipid phases in cow's milk
[from Lindmark Månsson 1998].
It is evident that such a procedure can only be used, if the production flow in the dairy is well known. The procedure described by Lindmark Månsson cannot be used if the milk product undergoes other treatments than the traditional separation of milk into aqueous and lipid phases for afterwards to to be mixed together to form sweet milk products with a standardized content of milk lipid. The procedure cannot be used, if the products undergo other treatments like for example ultrafiltration or fermentation.
| References |
![]()
- Bro-Rasmussen F.:
Statens Vitaminlaboratoriums undersøgelser over danske mejeriprodukters indhold af A-vitamin og caroten.
Statens Husholdningsråd, Faglige Meddelelser nr. 10, p. 37-40, 1956.
- Leth T.:
Danske levnedsmidlers indhold af E-vitamin samt tilnærmet beregning af af E-vitamintilførslen med den danske kost.
Statens Husholdningsråd, Tekniske Meddelelser nr. 1, p. 21-31, 1975.
- Hjarde W., Laier G., Leth T., Søndergård H., Sørensen A.:
Næringsstofindholdet i nyere mælkeprodukter.
Statens Levnedsmiddelinstitut, Publikation nr. 60, 1982.
- Søndergård H.:
Folinsyre i konsummælkprodukter.
Statens Levnedsmiddelinstitut, 1981.
- Statens Forsøgsmejeri:
Konsummælkprodukternes sammensætning og indhold af næringsstoffer.
Statens Forsøgsmejeri, May 1980.
- Larsen J., Werner H.:
Konsummælkprodukternes indhold af kulhydrat og mælke- og citronsyre [Carbohydrates, lactic acids and citric acid in liquid milk products].
243. Beretning.
Statens Forsøgsmejeri, June 1981.
- Larsen J., Werner H.:
Konsummælksprodukternes indhold af calcium, magnium, natrium, kalium, fosfor, klorid og jern [Calcium,magnesium, sodium, potassium, phosphorus, chloride and iron in liquid milk products].
Beretning nr. 257.
Statens Forsøgsmejeri, November 1984.
- Laustsen A. M., Jensen K. G.:
Konsummælksprodukternes indhold af tørstof, fedt og protein samt pH og titer [Total solids, fat, protein, pH and titratable acidity in market milk products].
Beretning nr. 260.
Statens Mejeriforsøg, December 1984.
- Larsen J., Werner H.:
Konsummælkprodukternes indhold af tungmetaller [Heavy metals in market milkproducts].
Beretning nr. 262.
Statens Mejeriforsøg, November 1985.
- Larsen J., Jensen F. H., Werner H.:
Konsummælksprodukternes indhold af vitamin A, B1, B2, C, D og E samt folacin [Vitamin A, B1, B2, C, D, E and folates in market milk products].
Beretning nr. 264.
Statens Mejeriforsøg, September 1985.
- Wienberg A., Leth T.:
Food Monitoring System for Nutirents - Dairy Products
Publication No. 151.
Levnedsmiddelstyrelsen, Søborg October 1987.
- Levnedsmiddelstyrelsen:
Overvågningssystem for levnedsmidler, Næringsstoffer og forureninger 1983-1987. Publikation nr. 187 (Marts 1990).
- Skotte Jacobsen J. and Leth T.:
Overvågningssystem for næringsstoffer - mejeriprodukter, 2. runde [Food Monitoring System for Nutrients - Dairy Products, 2nd cycle].
Intern rapport CLA92004.
Levnedsmiddelstyrelsen, december 1992.
- Levnedsmiddelstyrelsen:
Overvågningssystem for levnedsmidler 1988-1992.
Publikation nr. 232.
Levnedsmidedelstyrelsen, december 1995.
- Skotte Jacobsen J. and Knuthsen P.:
Overvågningssystem for næringsstoffer - mejeriprodukter, 3. runde [Food Monitoring System for Nutrients - Dairy Products, 3rd cycle].
Rapport IFE 1998.2
Veterinær- og Fødevaredirektoratet, maj 1997.
- Lund P., Thymark L.:
Sammensætning af smør og andre spisefedttyper [Composition of butter and other types of edible fat].
Forsøgsrapport nr. 29.
Statens Mejeriforsøg, February 1988.
- Lindmark Månsson H.:
Den svenska mejerimjölkens sammansättning 1996.
Rapport nr. 4968.
Svensk Mjölk Forskning, Lund, February 1999.
- Lindmark Månsson H.:
Den svenska mejerimjölkens sammansättning 2001.
Rapport nr. 7038-P.
Svensk Mjölk Forskning, Lund, December 2004.
- Lindmark Månsson H.:
Den svenska mejerimjölkens sammansättning 2009.
Rapport nr. 7094.
Svensk Mjölk Forskning, Lund, Mai 2012.
- Lindmark Månsson H.:
Den svenska mejerimjölkens sammansättning 2009.
Sammanfattning af analysresultat.
Rapport nr. 7090-P.
Svensk Mjölk Forskning, Lund, December 2010.
- Lindmark Månsson, H.:
Näringsvärden i mjölk- och gräddprodukter.
Rapport 4964.
Svensk Mjölk Forskning, Lund, December 2010.
- Andersson, I.:
Nutritional and sensory quality of heat processed liquid milk.
University of Lund, Sweden, Lund 1993.
- Fox, P. F.:
Advanced dairy chemistry. Lactose, water, salts and vitamins. (Vol. 3), 1997.
- Jensen R. G.:
The Composition of Bovine Milk Lipids: January 1995 to December 2000.
Journal of Dairy Science 85, pp. 295–350, 2002.
- Renner, E.:
Micronutrients in milk and milk-based food products.
Elsevier Science Publishers Ltd., Barking, Essex, England 1989.
- Walstra, P., & Jenness, R.:
Dairy chemistry and physics.
John Wiley & Sons, Inc. 1984.
- Molkentin J.:
Cholesterol content and lipid composition of low fat dairy products.
European Food Research and Technology 223, pp. 253–260, 2006.
- Nataf:
The Cholesterol Content of Cows' Milk.
The Journal of Nutrition Vol. 36, 4, pp. 495-506, 1948.
- Osthoff G., Hugo A., de Wit M., Mai Nguyen T. P.:
The chemical composition of milk from free-ranging African buffalo (Syncerus caffer).
South African Journal of Wildlife Research 39, 1, pp. 97–102, April 2009.
- Piironen V., Toivo J., Lampi A.-M.:
New Data for Cholesterol Contents in Meat, Fish, Milk, Eggs and Their Products Consumed in Finland.
Journal of Food Composition and Analysis 15, pp. 705-713, 2002.
- Precht D.:
Cholesterol content in European bovine milk fats.
Nahrung 45 (1) pp. 2-8, 2001
| ||
| ||
| ||
| ||
|
|
|
© 2025 Anders Møller, Danish Food Informatics | |
| The Compilers' Toolbox™ web site is provided and hosted by Danish Food Informatics. |