| - provided by Danish Food Informatics |
Estimating Component Values - Pork | |
| Updated 2019-11-01 | |
| Estimating Component Values of Pork |
![]()
Over the last half decade, the producers have reduced the amount of waste fat on pigs, and closer fat trimming procedures by processors and retailers have resulted in a considerable decrease in the fat content of Danish pork (Lassen et al 2002, Clausen & Ovesen 2001). It is therefore important that the data for estimating the nutrient intake from pork are up to date and as precise as possible.
The oldest broader Danish study of the composition of pork cuts dates back to the beginning of the 1970’es (Kramme Ejlersen, 1975, and Hansen et al, 1976). This study was conducted in collaboration by the Danish Meat Research Institute and the National Food Agency of Denmark. Already then, the reason objective for studying the pork composition was the findings of a lower fat content and following higher lean meat content of pork, which made pork more interesting from a nutritional point of view. As a result of the continued decreasing of the fat thickness of the average pork carcass in 1987-88, the Danish Meat Research Institute carried out additional analysis of protein and fat in retail cuts of pork based on specific information on pig race and trimming of cuts, which showed lower fat and higher protein values than the first broad study mentioned above (DMRI, 1988).
From 1982, the National Food Agency of Denmark established a food monitoring system that would analyse specific foods for certain nutrients in order to follow eventual changes in the nutritional value of the foods on the Danish market. For pork, two cuts, tenderloin and fillet of neck (collar, boneless) have been sampled, analysed and data reported periodically (1987, 1992 and 1997). The results show quite big differences between the samples of same cuts, but no significant changes in proximate, vitamin and mineral composition (Hansen et al., 1999).
Due to the importance of pork in the Danish diet, several more specific studies of the nutrient composition and the fate of the nutrients during preparation have been conducted. A rather big study comprising 200 samples investigates and compares data for five different pork cuts sampled at slaughterhouses and in retail (Knutsen & Okholm-Hansen 1998). The more recent studies include a comprehensive study on losses and gains in the proximate composition of pork cuts (protein, fat and moisture) using different methods of preparation and establishing relationships between proximate composition before and after cooking (Clausen and Ovesen, 2001).
Likewise, a study investigating the retention of thiamine, riboflavin and pyridoxamin and cooking yield in pork loin by conventional and enhanced meal-service systems has been conducted (Lassen et al., 2002), as well as a study of vitamin D3 and 25-hydroxyvitamin D3 in raw and cooked pork cuts (Clausen et al., 2003).
Together, these Danish studies give a broader picture of the nutrient composition in pork and they give important information about the relationships between the different components in pork for use in food composition databanks. Unfortunately, the Danish studies do not give the full picture of the nutrient composition of pork cuts with respect to coverage of nutrients, nor do they cover the whole range of approximately 25 standard pork cuts/trimmings available on the Danish retail market. Therefore, in order to construct a Danish pork composition dataset covering all important vitamins and minerals, Danish pork data must be complemented with data from foreign sources.
The purpose of the present study of pork data is to determine by statistical analysis of data from existing studies on pork cuts whether it is possible to reveal relationships between the proximates, vitamins and/or minerals, and if so, how to systematically describe the nutrient content in a specific pork cut from a few specific parameters, e.g. one or more of the proximates. The findings are compared with pork data from the two internationally acknowledged food composition data collections, the American USDA National Nutrient Database for Standard Reference (USDA SR16-1) and the British Foods Standards Agency, McCance and Widdowson’s The Composition of Foods, Sixth Summary Edition, Electronic version (McC&W, 2002).
| Methods |
![]()
| Sample studies |
The studies examined in this paper are the major studies in Denmark during the last 30 years, and the studies have been selected based on the following criterion:
- the study must include data on both proximate and vitamin or mineral composition for the same samples
This criterion rules out a series of studies in which only proximate composition or vitamin or mineral composition is described. For the examination in the report, it is of vital importance that information on one ore more of the proximates (in this case protein, fat, dry matter or moisture, and ash) and one or more vitamins and/or minerals are described.
The data from the selected studies are for comparison reasons extended with the data on raw pork from the two major food composition data collections, the American USDA food composition databank (USDA SR16-1, 2004) and the British Foods Standards Agency, McCance and Widdowson’s The Composition of Foods, Sixth Summary Edition, Electronic version (McC&W, 2002).
Description of the datasets included in this study are listed in the reference section below.
| Data preparation |
Data were entered in Microsoft® Excel spreadsheets from the sources twice, and the spreadsheet data compared to reduce incidents of typing errors. The spreadsheets are avalable from (link to be inserted)
| Data calculations |
For nutrients where metabolites' contribution to the final nutrient values could be identified, e.g for vitamin D, the data for both metabolites and the final calculated value was entered.
| Data analysis and statistics |
For the analysis, the DataAnalysis package of The Microsoft® Excel spreadsheet in connection with the Analyse-it® add-in (Analyse-it Software, Ltd.) was used.
Initially, data were plotted as x,y-plots (scatter plots) to examine
the data for visible correlation. The regression analysis on the data was
carried out with the Analyse-it included single, multiple linear regression and polynomial regression (upto 6th order) to determine fits that predict a response based on 1 or more predictor variables. Below only the most basic analyses are presented.
| Results |
![]()
In the following, the results of the comparisons of data will be presented by component group: macronutrients, vitamins and minerals. The results are commented and discussed, nutrient by nutrient.
| Macronutrients |
The macronutrient composition of pork takes into consideration the
content of carbohydrate, protein, lipid (and cholesterol), dry matter/moisture and ash.
| Carbohydrate |
The content of carbohydrate content of pork is usually regarded to be zero, except in offals and products thereof which are not considered in this study. However, newer studies of the carbohydrate content of pork (Meinert et al. 2009) show that there is a small content of sugars in the muscles, approximately 1.5 g/100 g edible portion, which are important for the flavour building during the preparation of pork.
Meinert et al. found the following content of carbohyrates in pork cuts:
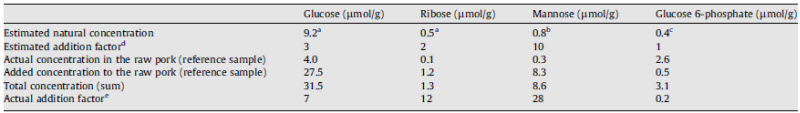
From Meinert et al. 2009.
| Protein |
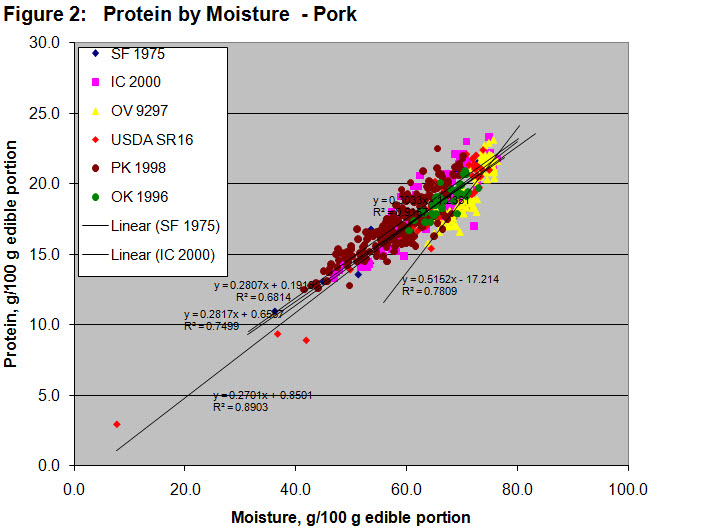
For protein there is a clear relationship
with the fat content (figure 1) and the moisture content (figure 2).
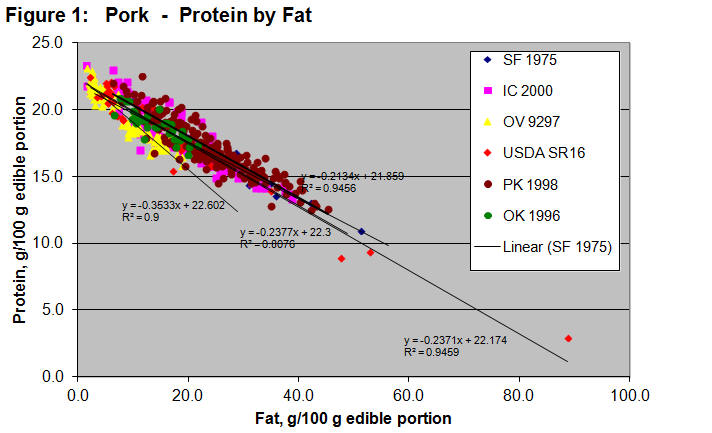
The correlation of protein by fat is in all cases significant (p<0.001) and for all studies, except OV9297, the dependency of protein by fat is fairly the same as for the USDA SR16-1 data. A possible reason for the OV 9297 data to have a steeper negative slope may be explained by the sampling of data in the Danish Food Monitoring as only pork cuts with relatively low fat contents (tenderloin and collar, boneless) are sampled.
| Lipids |
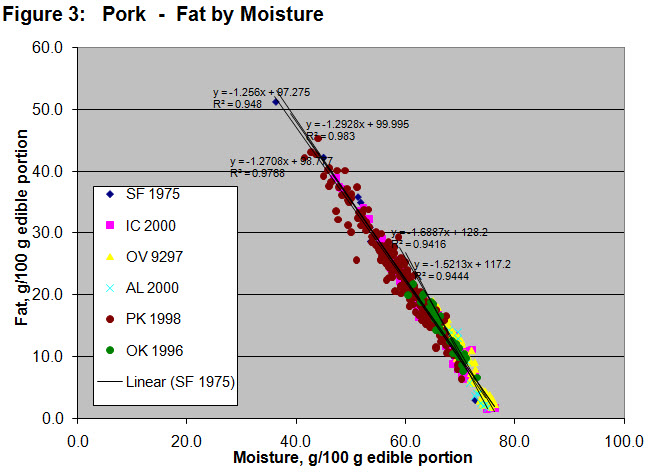
Similar to the findings for protein, there is
a clear correllation (p<0.001) of the lipid content of pork and the
moisture content (figure 3):
| Cholesterol |
To be filled in.
| Dry matter |
To be filled in.
| Ash |
The data on ash show some dependency
on…, … but comparison with USDA SR16-1 data reveals some strange data
for the USDA data. There are some extreme outliers in the USDA dataset,
both on the low and high fat and dry matter areas. A closer inspection
of these data points does not reveal any reason for the outlier values.
They are all lean meat values. A possible explanation for the high
fat/dry matter outlier could be a magnitude error, as 1/10th of the
value would fit perfectly in the linearity. The outliers at low fat/dry
matter levels, we have no explanation for, except if the data in the
USDA dataset originally are calculated from other proximates.
| Vitamins |
| Retinol |
To be filled in.
| Beta-carotene |
To be filled in.
| Vitamin D - cholecalciferol and 25-hydroxy cholecalciferol |
To be filled in.
| Vitamin E - α-tocopherol |
The vitamin E (α-tocopherol) content shows no relationsship with any of the macronutients. One of the reasons may be that vitamin E is commonly used as dietary vitamin E supplementation, i.e. added to the feed of pigs as an antioxidant and to preserve the colour stability of pork during shelf life.
| Vitamin B1 - Thiamin |
To be filled in.
| Vitamin B2 - Riboflavin |
To be filled in.
| Niacin |
To be filled in.
| Vitamin B6 |
To be filled in.
| Pantothenic Acid |
To be filled in.
| Folates |
To be filled in.
| Vitamin B12 |
To be filled in.
| Vitamin C |
To be filled in.
| Minerals |
| Sodium |
To be filled in.
| Potassium |
To be filled in.
| Calcium |
Calcium shows no dependency on any macronutrient and the natural variation in the calcium content of pork cuts is extremely high in comparison with any dependency of another nutrient component.
More to come.
| Magnesium |
To be filled in.
| Phosphorous |
To be filled in.
| Manganese |
To be filled in.
| Zinc |
To be filled in.
| Conclusions |
![]()
To be filled in.
| References |
![]()
- Reykdal Ó., Sigurðsson, Á. Ó., Þorkelsson G. (1986):
Efnagreiningar á kjöti 1984-86.
Fjölrit Rala 120.
Rannsóknastofnun landbunaðarins, Október 1986.
- Buege, D. R., Ingham, B. H., Henderson, D. W., Watters, S. H., Borchert,
L. L., Crump, P. M., Hentges, E. J. (1998):
A Nationwide Audit of the Composition of Pork and Chicken Cuts at Retail.
J. Food Comp. Anal. 11, 249–261, 1998.
- Clausen, I. and Ovesen, L. (2001):
Proximate Contents, Losses and Gains of Fat, Protein and Water Compating Raw, Hospital- and Household-Cooked Pork Cuts.
J. Food Comp. Anal. 14, 491-503.
- Clausen, I., Jakobsen, J., Leth, T., and Ovesen, L. (2003):
Vitamin D3 and 25- hydroxyvitamin D3 in raw and cooked prok cuts.
J. Food Comp. Anal. 16, 575-585.
- Cormier, A., Vautour, G., and Allard, J. (1996):
Canada-Wide Survey of the Nutritional Composition of Six Retail Pork Cuts.
J. Food Comp. Anal. 9, 255-268, 1996.
- Danske Slagterier (2002):
The Danish export of Pig Meat. [http://www.danskeslagterier.dk]
- Danske Slagterier, The National Committee for Pig Production
(2003):
Annual Report 2003. [http://www.danskeslagterier.dk]
- Danish Meat Research Institute (1988):
Nutrient values. Percent protein and percent fat in raw pork cuts.
Report No. 02.528-02.
- Esteve, M.J., Farré, R., Frígola, A., and Pilamunga, C. (2002):
Contents of vitamins B1, B2, B6, and B12 in pork and meat products.
Meat Sci. 62, 73-78.
- Hansen, K. and Knuthsen, P. (1999):
Overvågningssystem for næringsstoffer - Kød, 3. runde [Monitoring System for Nurtients - Meat, Third Cycle].
Danish Veterinary and Food Administration, FødevareRapport 1999:10.
- Knuthsen, P. and Okholm-Hansen, B. (1998):
Næringsstofindhold i udskæringer af svinekød (Nutrients in pork cuts).
Intern Raport IFE 1998.3, project no. 95641-01.
Danish Veterinary and Food Administration.
- Kramme Ejlersen, J. (1975):
Næringsværdi i dansk svinekød og produkter heraf (Nutrient value of Danish pork and products hereof).
Manuscript. No. 551.
Danish Meat Research Institute.
- Lassen, A., Kall, M., Hansen, K., and Ovesen, L. (2002):
A comparison of the retention of vitamins B1, B2 and B6, and cooking yield in pork loin with conventional and enhanced meal-service systems.
Eur. Food Res. Technol. 215,194–199.
- Leth T., Knuthsen, P., and Larsen, E.H. (2001):
Nutrients. Monitoring System for Foods, 1993-1997 - Part 1.
Danish Veterinary and Food Administration, FødevareRapport 2001:17.
- Mattila, P.H., Piironen, V.I., Uusi-Rauva, E.J., and
Koivistoinen, P. (1995):
Contents of Cholecalciferol, Ergocalciferol, and Theur 25-Hydoxylated metabolites in Milk Products and Raw Meat and Liver as Determined by HPLC.
J. Agric. Food Chem. 43, 2394-2399.
- McC&W (2002):
Foods Standards Agency, McCance and Widdowson’s The Composition of Foods, Sixth Summary Edition.
Electronic version.
- Meinert L., Schäfer A., Bjergegaard C., Aaslyng M.D., Bredie
W.L.P. (2009):
Comparison of glucose, glucose 6-phosphate, ribose, and mannose as flavour precursors in pork; the effect of monosaccharide addition on flavour generation.
Meat Science 81, 419–425. [doi:10.1016/j.meatsci.2008.08.018]
- Okholm-Hansen B., Knuthsen P. (1996):
Næringsstofindhold i hakket kød [Nutrients in minced meat].
Rapport IL 1996.2 - projektnr. 94641-01.
National Food Agency of Denmark, December 1996.
- Piironen, V., Syväoja, E.-L., Varo, P. Salminen, K. and
Koivistoinen, P. (1985):
Tocopherols and Tocotrienols in Finnish Foods: Meat and Meat Products.
J. Agric. Food Chem. 33, 1215-1218.
- Piironen, V., Toivo, J., and Lampi, A.-M. (2002):
New Data for Cholesterol Contents in Meat, Fish, Milk, Eggs and Their Products Consumed in Finland.
J. Food Comp. Anal. 15, 705-713.
- Schmid A., Walther B. (2013):
Natural Vitamin D Content in Animal Products.
Adv Nutr vol. 4: 453-462, 2013.
- USDA SR16-1 (2004):
U.S. Department of Agriculture, Agricultural Research Service. 2004.
USDA Nutrient Database for Standard Reference, Release 16-1. Nutrient Data Laboratory [http://www.nal.usda.gov/fnic/foodcomp]
- Patterson K. Y., Trainer D., Holden J. M., Howe J. C., Buege
D. R., Williams J. R., Snyder C., Boillot K, Lofgren P., Thompson
L., Luna A., Doughlas L. W. (2009):
USDA Nutrient Data Set for Fresh Pork (from SR), Release 2.0.
Nutrient Data Laboratory (NDL), Agricultural Research Service, U.S. Department of Agriculture, October 2009.

- Zanardi, E.,Novelli, E., Ghiretti, G.P., Dorigoni, V., and
Chizzolini, R. (1999):
Colour stability and vitamin E content of fresh and processed pork.
Food Chem. 67, 163-171, 1999.
- Gerber N., Scheeder M., Wenk C. (2006):
Schweizerische Nährwerttabelle für Fleisch und Fleischwaren - Wissenschaftliche Fassung.
Institut für Nutztierwissenschaften, Gruppe Ernährungsbiologie ETH Zürich.
Zürich, Juli 2006.
- Williams J., Patterson K., Howe J., Snyder C., Boillot K.,
Lofgren P., Thompson L., Luna A., Nalawade A., Douglass L., Holden
J. (2009):
Nutrient Composition in Ground Pork using Regression Techniques.
Institute of Food Technologists (IFT), June 6-10, 2009, Anaheim, California.
![]()
| ||
| ||
| ||
| ||
|
|
|
© 2025 Anders Møller, Danish Food Informatics | |
| The Compilers' Toolbox™ web site is provided and hosted by Danish Food Informatics. |