| - provided by Danish Food Informatics |
Estimating Component Values - Fish | |
| Updated 2015-08-16 | |
| Classification of fish species on the lipid content |
![]()
The terminology concerning classification of fish depending on the lipid content is not completely clear. There are however two major different groups of fish, the oily fish or fatty fish and the whitefish/white fish or lean fish defined by the way the fish species store lipids - in the tissue or in the liver.
The oily/fatty fatty fish have high content of lipids (up to 30% depending on species) stored in their tissues, between the meat and skin, and in the belly cavities. The oily fish are typically pelagic fish living in the open zone of the water (sea or lake) neither near the bottom nor near the shore. The group typically include capelin, sardines, herring and anchovies and the larger salmon, trout, tuna and mackerel.
The whitefish/white fish/lean fish are typically lean fish with a low lipid content in the tissue, only the liver has a high lipid content. In whitefish, the liver is where the lipids are stored. The whitefish/white fish/lean fish are typically demersal fish living near the sea botoom or on the sea bottom. Typical examples are cod, haddock and flatfishes.
Based on the lipid content of the fish, the whitefish typically have
a lipid content of 0-2 g/100 g, oily/fatty fish typically 8-25 g/100 g,
but especially for the oily/fatty fish there are big variations in the
lipid content for the same species depending on the season. Often a
group of semi-oily/fatty fish is introduced, 2-8 g/100 g.
Exler sets a cross-over point between oily/fatty fish and whitefish/lean
fish at 5 g lipid/100 g - the point beyond which, the lipid conversion
factor do not change noteworthily (se
Toolbox's Fatty acids).
| Estimating Component Values for Fish |
![]()
In fish, the macronutrient composition, i.e. the content of protein, lipids, dry matter (moisture) and ash, is important for the post-mortem technological treatment. Therefore, the macronutrient composition of fish, especially the protein, lipid and dry matter content, has been studied intensively for many years.
| The Lipid-Moisture Relation |
There are clear signs of a linear relationship between the lipid and the moisture content in fish. Many authors have investigated this
relationship. Detailed results of some of their investigations can be found on the
Fish - Lipid - Moisture page.
From the investigated findings, which currently are 639 data points representing 41 fish species, the following linear fit can be found:
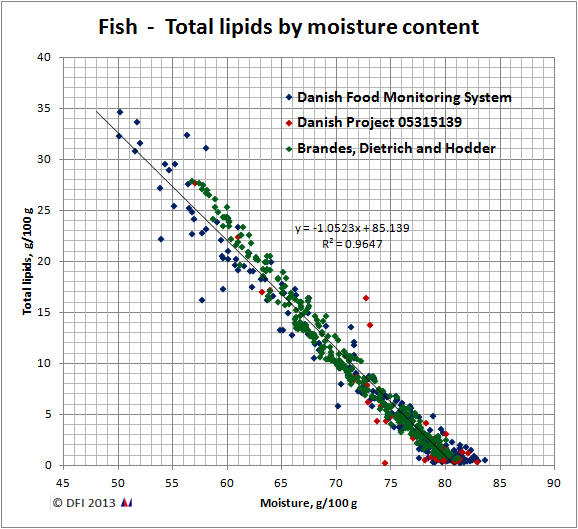
The findings lead to an average linear fit (p<0.0001) for the total lipid by moisture relationship for all fish species of
y = -1.05 * x + 85.1
| where | x: moisture content in the edible fish flesh, g/100 g |
| y: lipid content in the fish, g/100 g |
Similary, the depiction of moisture by total lipids in fish results in:
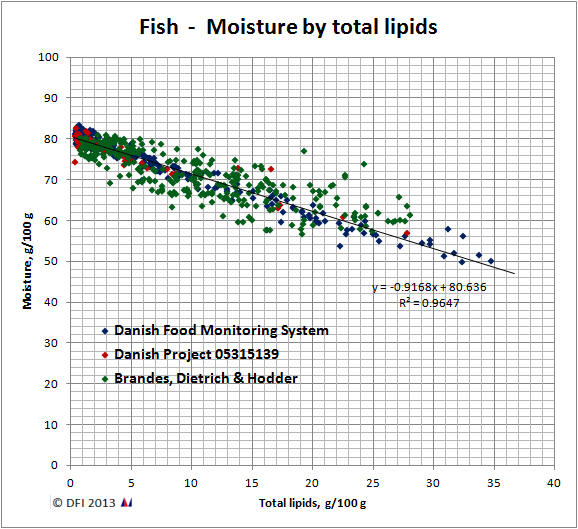
an average linear fit (p<0.0001) for the moisture by total lipids relationship for all fish species of
y = -0.92 * x + 80.6
| where | x: lipid content in the edible fish flesh, g/100 g |
| y: moisture content in the fish, g/100 g |
It should be noted that many factors influence on the actual content
of macro and micro nutrient in fish. The composition of fish is
extremely dependent on the fish species, the season, the fishing area, the feed
available for the fish, and may other factors.
The relationships listed are only rough estimates.
| The Protein-Moisture Relation |
The relation between protein and moisture is less outspoken.
To be continued.
| Other relations between components in fish |
To be continued.
| References |
![]()
- Atwater W. O. (1892):
The chemical composition and nutritive values of food fishes and aquatic invertebrates.
Part XIV. Report of the Commissioner for 1888, pp. 679-868.
United States Commission of Fish and Fisheries.
Government Printing Office, Washington 1892.
- Clark E. D., Almy L. H. (1918):
A Chemical Study of Food Fishes - The Analysis of Twenty Food Fishes with Especial reference to a Seasonal Variation in Composition.
Journal of Biological Chemistry 33, 483-498, 1918.
- Brandes C. H. & Dietrich, R. (1956):
Studies on fat and water contents of the edible part of the redfish (Sebastes marinus L.) (translation).
Fette, Seifen, Anstrichmittel, 58 (6), 433–439, 1956.
- Brandes C. H. & Dietrich R. (1957):
Relationship between the protein content and the nutritive condition of the Norway redfish (Sebastes marinus L.) (translation).
Fette, Seifen, Anstrichmittel, 59 (6), 434–437, 1957.
- Brandes C. H. & Dietrich R. (1953):
Zusammenfassende betrachtungen uber den Fett- un Wasser- gehalt im essbaren Anteil des Harings.
Fette, Seifen, Anstrichmittel, 55, 533-541, 1953.
- Brandes C. H. & Dietrich R. (1954):
Über die Bestimmung des Fettgehaltes im ganzen, unausgenommenen Hering auf Grund der Korrelation Fett und Wasser.
Fette, Seifen, Anstrichmittel Volume 56, Issue 7, pages 495–499, 1954.
- Brandes C. H. & Dietrich R. (1958):
Some aspects of the relationship between fat and water content, and fat distribution, in edible fishes (translation).
Veröffentlichungen des Instituts für Meeresforschung in Bremerhaven. 5: 299-305, 1958.
- Thurston E. (1961):
Proximate Composition of Nine Species of Sole and Flounder.
Journal of Agricultural and Food Chemistry Vol. 9, No. 4, 313-316, 1961.
- Brooke R. O., Ravesi E. M., Steinberg M. A. (1962):
The Composition of Commercially Important Fish Taken From New England Waters.
II. Proximate Analyses of Butterfish, Flounder, Pollock, and Hake, and Their Seasonal Variation.
Food Research, 27, 73–76, 1962.
- Stoddard J.H. (1967):
Studies of the condition (fatness) of herring.
Technical report 5. Fisheries Research Board of Canada, 1967.
- Stoddard J.H. (1968):
Fat content of Canadian Atlantic herring.
Technical report 79, Fisheries Research Board of Canada, 1968.
- Hardy R. and Keay J. N. (1972):
Seasonal variations in the chemical composition of Cornish mackerel, Scomber scombrus (L), with detailed reference to the lipids.
International Journal of Food Science & Technology 7, 125-137, 1972.
- Hodder V.M., Parsons L.S., Winters G.H., Spencer, K. (1973):
Fat and water content of herring in Newfoundland and adjacent waters, 1966-71.
Technical report 365, Fisheries Research Board of Canada, 1973.
- Sidwell V. D., Foncannon P. R., Moore N. S., Bonnet J. C. (1974):
Composition of the Edible Portion of Raw (Fresh or Frozen) Crustaceans, Finfish , and Mollusks. I. Protein, Fat, Moisture, Ash, Carbohydrate, Energy Value, and Cholesterol.
MFR Paper 1043.
Marine Fisheries Review, Vol. 36, No.3, March 1974.
- Sidwell, V.D. (1981):
Chemical and Nutritional Composition of Finfishes, Whales, Crustaceans, Mollusks, and Their Products.
NOAA Technical Memorandum NMFS F/SEC-11 (432 p.).
National Oceanic and Atmospheric Administration, National Marine Fisheries Service
U.S. Department of Commerce, January 1981
- Gooch J. A., Hale M. B., Brown Jr. T., Bonnet J. C., Brand C.
G., Regier L. W. (1987):
Proximate and Fatty Acid Composition of 40 Southeastern U.S. Finfish Species.
NOAA Technical Report NMFS 54.
National Marine Fisheries Service, National Oceanic and Atmospheric Administration (NOAA).
U. S. Department of Commerce, June 1987.
- Krzynowek J. and Murphy J. (1987):
Proximate composition, energy, fatty acid, sodium, and cholesterol content of finfish, shellfish, and their products.
NOAA Technical Report NMFS 55.
National Marine Fisheries Service, National Oceanic and Atmospheric Administration (NOAA).
U. S. Department of Commerce, July 1987.
- Skotte Jacobsen J. and Leth T. (1989):
Food Monitoring System for Nutrients - Fish and Fish Products (in Danish).
Publikation nr. 179.
National Food Agency of Denmark, Søborg, marts 1989.
- Krzynowek J., Murphy J., Manny R.S., Panunzio, J.R. (1989):
Proximate Composition and Fatty Acid and Cholesterol Content of 22 Northwest Atlantic Finfishes.
NOAA Technical Report NMFS 74.
National Marine Fisheries Service, National Oceanic and Atmospheric Administration (NOAA).
U. S. Department of Commerce, May 1989.
- Rajasilta M. (1992):
Relationship between Food, Fat, Sexual Maturation, and Spawning Time of Baltic Herring (Clupea harengus membras) in the Archipelago Sea.
Canadian Journal of Fisheries and Aquatic Sciences 49(4), 644-654, 1992.
- Grégoire F., Dionne F. H., Lévesque C. (1994):
Fat content of Atlantic mackerel (Scomber scombrus L.) in 1991 and 1992.
Canadian lndustry Report of Fisheries and Aquatic Sciences 220.
Fisheries Science Branch, Department of Fisheries and Oceans, Maurice Lamontagne Institute, 1994.
- Pedersen, A. N. and Meyland I. (1994):
Nutrient data for 41 fish species (unpublished data).
Institut for levnedsmiddelkemi og ernæring, Søborg, 1994.
- Skotte Jacobsen J. and Leth T. (1994):
Food Monitoring System for Nutrients - Fish 2. cycle (in Danish).
Project 911501 - Internal report ILE 1994.2.
National Food Agency of Denmark, Søborg, januar 1994.
- Skotte Jacobsen J. and Knuthsen O. (2000):
Food Monitoring System for Nutrients - Fish 3. cycle (in Danish).
FødevareRapport 1999:09.
Danish Veterinary and Food Administration, Søborg, maj 2000.
- Yeannes, M. I. and Almandos, M. E. (2003):
Estimation of fish proximate composition starting from water content.
Journal of Food Composition and Analysis, 16, 81–92, 2003.
- Jensen K. N., Jacobsen C., Nielsen H. H. (2007):
Fatty acid composition of herring (Clupea harengus L.): influence of time and place of catch on n-3 PUFA content.
Journal of the Science of Food and Agriculture 87, 710-718, 2007.
- Lane H. A., Westgate A. J., Koopman H. N. (2011):
Ontogenetic and temporal variability in the fat content and fatty acid composition of Atlantic herring (Clupea harengus) from the Bay of Fundy, Canada.
Fishery Bulletin 109, 113–122, 2011.
- Reykdal Ó., Jörundsdóttir H. Ó., Desnica N., Hauksdóttir S.,
Ragnarsdóttir Þ., Vrac A., Gunnlaugsdóttir H., Pálmadóttir H. (2011):
Næringargildi sjávarafurða. Meginefni, steinefni, snefilefni og fitusýrur í lokaafurðum.
Skýrsla Matís 33-11, Október 2011.
ISSN 1670-7192
- Öhrvik V., von Malmborg A., Mattisson I., Wretling S., Åstrand
C. (2012):
Fisk, skaldjur och fiskprodukter - analys av näringsämnen.
Rapport 1 - 2012.
Livsmedelsverket (National Food Agency), Sweden 2012.
ISSN 1104-7089
- Myhre J. B., Borgejordet Å, Nordbotten A., Løken E. B., Fagerli
R. Aa. (2012):
Nutritional composition of selected wild and farmed raw fish.
Joint report of Univarsity of Oslo, Norwegian Food Safety Authority and the Norwegian Directorate of Health, 2012.
- Food Composition and Diet Team, Public Health Directorate (2013):
Nutrient analysis of fish and fish products - Summary Report.
Department of Health, UK Government, March 2013.
![]()
| ||
| ||
| ||
| ||
|
|
|
© 2025 Anders Møller, Danish Food Informatics | |
| The Compilers' Toolbox™ web site is provided and hosted by Danish Food Informatics. |