| - provided by Danish Food Informatics |
Estimating Component Values - Fish | |
| Updated 2015-08-15 | |
| Estimating Component Values for Fish - Lipid - Moisture |
![]()
In fish, the proximate composition is important for the post-mortem technological treatment. Therefore, the proximate composition of fish has been studied intensively for many years.
| The Lipid-Moisture Relation |
More than a century ago, scientists found the "fundamental relation ... is that as the fat content increases the water content decreases, and the fat-free solids remain practically the same". This was described already by Atwater (1888).
Similar findings were taken up by Clark and Almy (1918), who similarly found that there seems to be a striking relationship between the content of lipid and moisture. They further described "that the fat-free solids, which consist of nitrogenous and mineral constituents, vary but slightly from the mean value of about 21 per cent, showing that the gain or loss in fat is compensated for by a corresponding gain or loss in moisture rather than protein".
These findings indicate that the sum of lipid and moisture for fish is around 80% of the edible part of the fish. The lipid content may vary significantly, always with the moisture varying in the similar way, but oposite the lipid content.
Brandes and Dietrich (1953, 1954, 1957, and 1958) working with the
Institut für Meeresforschung (Institute for Marine Research),
Bremerhaven, Germany, studied in the first place the physiological
properties of Atlantic herring (Clupea harengus Linnaeus, 1758) and
Atlantic ocean perch/Norway haddock (Sebastes marinus
(Linnaeus, 1758)) caught in the North-East Atlantic Ocean.
Their studies on the lipid and moisture content of the
edible part of the fish (flesh) showed that there is a high correlation between
the lipid and mositure content of the two fish species. Futhermore,
Brandes and Dietrich showed that the correlation is independent of the
biological state of the fish, i.e. independent of the specific fishing area, season
or age or sex of the fish.
Shown below is the inverse linear relationship between lipid and moisture found by Brandes and Dietrich in the early 1950's:
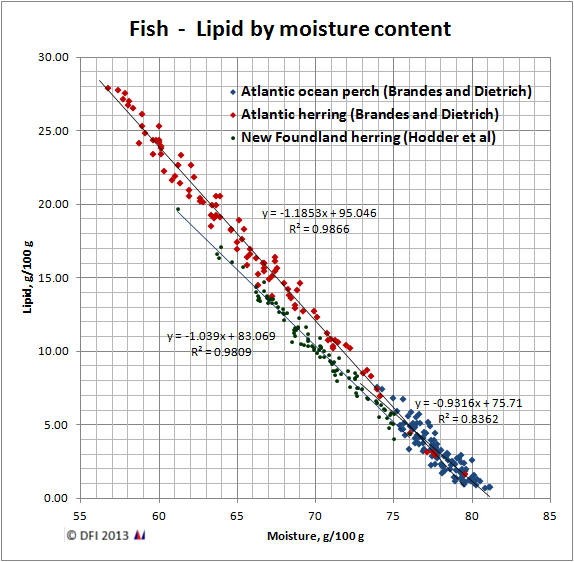
Apart from the apparent linear relation between moisture (dry matter) and lipid content in the fish flesh, the interesting issue about these data is that the data represents the two kinds of fish species, the fatty fish (Atlantic herring) with a lipid content >5% and the lean fish (Atlantic ocean perch) with an average lipid content of <5%.
Using the original data of Brandes and Dietrich, the linear regression model can be expressed as
| Atlantic herring: | y = -1.1853 * x + 95.046 (n=100, R2 = 0.9866, p<0.0001) |
| Atlantic ocean perch: | y = -0.9316 * x + 75.71 (n=110, R2 = 0.8362, p<0.0001) |
| where | x: moisture content in fish, g/100 g | |
| y: lipid content in fish, g/100 g |
Based on the results with Atlantic herring and Atlantic
ocean perch where, regardless of the biological behaviour of the two
species of fish, the ratio between water and fat in the muscles was
approximately the same, they continued their biological-chemical
examinations, questioning whether this relation might apply to all
commercial fish (Brandes and Dietrich, 1958).
Thurston (1961) analysed nine species of sole and flounder (Pleuronectidae). The 240 samples were analysed for moisture, lipid, protein, ash, sodium and potassium. For the edible part of the fish species, the average moisture content varied between 79.8 and 83.6 g/100 g with the lipid content varying opposite 2.39 to 0.53 g/100 g. As all samples in this study were lean fish, the lipid-moisture relationship was not outspoken.
Likewise, Hardy and Keay (1972) observed an inverse linear relationship between lipid and water content with the protein level remaining substantially constant in their study of Atlantic mackerel, but did not comment futher on the subject.
In their investigations on herring, Hodder et al (1973) futher
investigated the lipid-water relation. They found "that there appears to be a gradual
increase in the total fat plus water content with increasing fat
content; fish with fat content values less than 5% have on the average a
total fat plus water content of just under 80%, and those with over 20%
fat have a total fat plus water content of about 81.5%.
Herring with low fat content values tended to have lower total fat plus
water content values than fish with higher fat content values.
Regression analysis indicated that the relationship between the fat and
water content was not strictly linear, but rather was better described
by the quadratic equation, where the lipid content, y, is
y = 108.37 - 1. 727 * x + 0.004645 * x2
| where | x: moisture content in the herring filets, g/100 g | |
| y: lipid content in fish, g/100 g |
As can be seen from the figure above, the herring data of Hodder and all do not completely fit the data of Brandes and Dietrich. The average lipid content estimated Hodder et al's equation lies about 2 g lipid/100 g to low compared to Brandes and Dietrich's data - more distance for high mositure content than for low.
Using the data published by Hodder et al, it has not
been possible to reconstruct the poloynomial regression model.
Their published data fit a linear regression model
(p<0.0001):
y = -1.039 * x + 83.069
| where | x: moisture content in the herring filets, g/100 g |
| y: lipid content in fish, g/100 g |
Furthermore, analyzing the data of both Brandes and
Dietrich and Hodder et al, their data show that there is a clear
relation between the lipid and sum and lipid and moisture - as lipid
goes up (or moisture goes down), the sum of lipid and moisture goes up,
i.e. the sum of moisture and lipid does not seem to be constant around
80%, but increases slightly with decreasing moisture content.
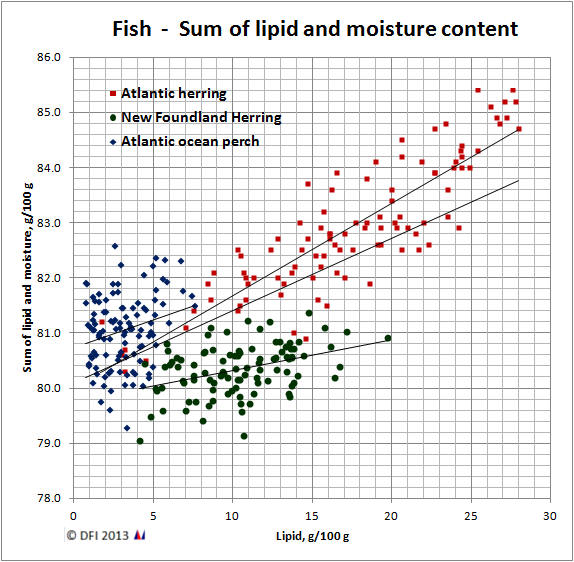
With the available data it is not possible to give a more precise description of the relationship, and maybe Hodder et al's postulate is a bit underestimated. The data show that the sum of lipid and moisture in the two fish species is around 80-81% for fish with low lipid content (<5% lipid) and rising to 84-85% for fish with a high lipid content (>20% lipid).
| Danish Food Monitoring Data on Fish |
In the Danish Food Monitoring System for Nutrients fish was sampled four times over a twenty year period. The sampling included Atlantic herring (Clupea harengus Linnaeus, 1758), Baltic herring (Clupea harengus membras Linnaeus, 1758), Atlantic mackerel (Scomber scombrus Linnaeus, 1758), European plaice (Pleuronectes platessa Linnaeus, 1758 ), European flounder (Platichthys flesus (Linnaeus, 1758)), Atlantic cod (Gadus morhua Linnaeus, 1758), and rainbow trout (Oncorhynchus mykiss (Walbaum, 1792)). The fish samples were taken in different fishing areas - mainly the Baltic Sea and Kattegat, Skagerak and the North Sea - and sampling was distributed over the whole year in order to catch seasonal variations.
The analytical results of three of the four periods has been published, and the results show very clear differences between Atlantic herring and Baltic herring concerning the lipid and fatty acid composition as well as very distinct seasonal variations in the content of total lipids for Atlantic herring, Baltic herring and Atlantic mackerel.
Despite the varying content of lipids and seasonal variations as well
as variations between fishing areas, the fat-water relationship in the
sampled fish species is amazingly constant as seen in the graph below:
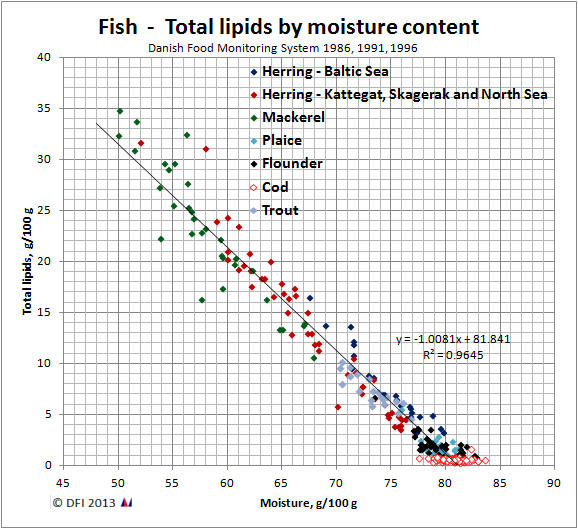
The linear fit (p<0.0001) for the moisture-total lipid relationship of the seven fish species/subspecies is
y = -1.0081 * x + 83.841
| where | x: moisture content in the edible fish flesh, g/100 g |
| y: lipid content in fish, g/100 g |
Similar results - although slightly less evident - have been found in another
Danish analytical project
(05315139) concerning the nutrient content of fish dish recipes in which
raw filets of 41 different fish species were analysed (pooled sample for
each specie, 2
replicates for each pooled sample):
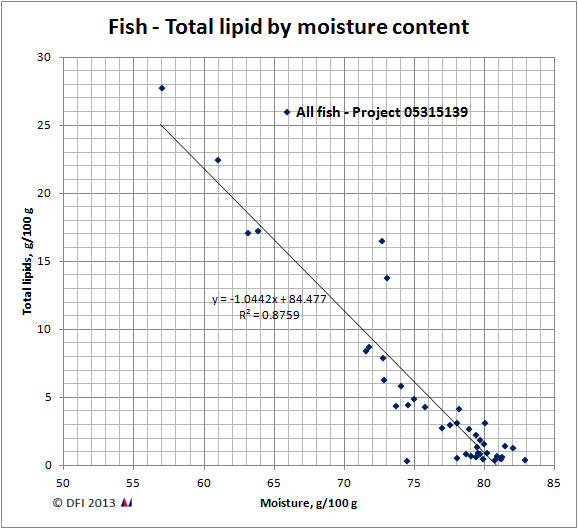
The results show the same picture of the relation between moisture and lipid content as other results mentioned above. The linear fit (p<0.0001) for the moisture-total lipid relationship of the 41 different fish species is
y = -1.04421 * x + 84.477
| where | x: moisture content in the edible fish flesh, g/100 g |
| y: lipid content in fish, g/100 g |
| Conclusion on the lipid-moisture relation |
There is no doubt that there is a clear relation between the lipid and moisture content in fish as shown by the results of the investigations above. There may however be some minor differences between different fish species or same species from different fishing areas. Whether these differences can be explained by analytical differences for the analysed data, differences in sampling, differences in the fish tribes and species, differences in fishing areas or feed or any other issues is not clear from the available data.
| References |
![]()
- Atwater W. O.:
The chemical composition and nutritive values of food fishes and aquatic invertebrates.
Part XIV. Report of the Commissioner for 1888, pp. 679-868.
United States Commission of Fish and Fisheries.
Government Printing Office, Washington 1892.
- Clark E. D., Almy L. H.:
A Chemical Study of Food Fishes - The Analysis of Twenty Food Fishes with Especial reference to a Seasonal Variation in Composition.
Journal of Biological Chemistry 33, 483-498, 1918.
- Brandes C. H. & Dietrich, R.:
Studies on fat and water contents of the edible part of the redfish (Sebastes marinus L.) (translation).
Fette, Seifen, Anstrichmittel, 58 (6), 433–439, 1956.
- Brandes C. H. & Dietrich R.:
Relationship between the protein content and the nutritive condition of the Norway redfish (Sebastes marinus L.) (translation).
Fette, Seifen, Anstrichmittel, 59 (6), 434–437, 1957.
- Brandes C. H. & Dietrich R.:
Zusammenfassende betrachtungen uber den Fett- un Wasser- gehalt im essbaren Anteil des Harings.
Fette, Seifen, Anstrichmittel, 55, 533-541, 1953.
- Brandes C. H. & Dietrich R.:
Über die Bestimmung des Fettgehaltes im ganzen, unausgenommenen Hering auf Grund der Korrelation Fett und Wasser.
Fette, Seifen, Anstrichmittel Volume 56, Issue 7, pages 495–499, 1954.
- Brandes C. H. & Dietrich R.:
Some aspects of the relationship between fat and water content, and fat distribution, in edible fishes (translation).
Veröffentlichhungen des Instituts für Meresforschung in Bremerhaven. 5: 299-305, 1958.
- Thurston E.:
Proximate Composition of Nine Species of Sole and Flounder.
Journal of Agricultural and Food Chemistry Vol. 9, No. 4, 313-316, 1961.
- Brooke R. O., Ravesi E. M., Steinberg M. A.:
The Composition of Commercially Important Fish Taken From New England Waters.
II. Proximate Analyses of Butterfish, Flounder, Pollock, and Hake, and Their Seasonal Variation.
Food Research, 27, 73–76, 1962.
- Stoddard J.H.:
Studies of the condition (fatness) of herring.
Technical report 5. Fisheries Research Board of Canada, 1967.
- Stoddard J.H.:
Fat content of Canadian Atlantic herring.
Technical report 79, Fisheries Research Board of Canada, 1968.
- Hardy R. and Keay J. N.:
Seasonal variations in the chemical composition of Cornish mackerel, Scomber scombrus (L), with detailed reference to the lipids.
International Journal of Food Science & Technology 7, 125-137, 1972.
- Hodder V.M., Parsons L.S., Winters G.H., Spencer, K.:
Fat and water content of herring in Newfoundland and adjacent waters, 1966-71.
Technical report 365, Fisheries Research Board of Canada, 1973.
- Sidwell V. D., Foncannon P. R., Moore N. S., Bonnet J. C.:
Composition of the Edible Portion of Raw (Fresh or Frozen) Crustaceans, Finfish , and Mollusks. I. Protein, Fat, Moisture, Ash, Carbohydrate, Energy Value, and Cholesterol.
MFR Paper 1043.
Marine Fisheries Review, Vol. 36, No.3, March 1974.
- Gooch J. A., Hale M. B., Brown Jr. T., Bonnet J. C., Brand C.
G., Regier L. W.:
Proximate and Fatty Acid Composition of 40 Southeastern U.S. Finfish Species.
NOAA Technical Report NMFS 54.
National Marine Fisheries Service, National Oceanic and Atmospheric Administration (NOAA).
U. S. Department of Commerce, June 1987.
- Skotte Jacobsen J. and Leth T.:
Food Monitoring System for Nutrients - Fish and Fish Products (in Danish).
Publikation nr. 179.
National Food Agency of Denmark, Søborg, marts 1989.
- Grégoire F., Dionne F. H., Lévesque C.:
Fat content of Atlantic mackerel (Scomber scombrus L.) in 1991 and 1992.
Canadian lndustry Report of Fisheries and Aquatic Sciences 220.
Fisheries Science Branch, Department of Fisheries and Oceans, Maurice Lamontagne Institute, 1994.
- Pedersen, A. N. and Meyland I.:
Nutrient data for 41 fish species (unpublished data).
Institut for levnedsmiddelkemi og ernæring, Søborg, 1994.
- Skotte Jacobsen J. and Leth T.:
Food Monitoring System for Nutrients - Fish 2. cycle (in Danish).
Project 911501 - Internal report ILE 1994.2.
National Food Agency of Denmark, Søborg, januar 1994.
- Skotte Jacobsen J. and Knuthsen O.:
Food Monitoring System for Nutrients - Fish 3. cycle (in Danish).
FødevareRapport 1999:09.
Danish Veterinary and Food Administration, Søborg, maj 2000.
- Yeannes, M. I. and Almandos, M. E.:
Estimation of fish proximate composition starting from water content.
Journal of Food Composition and Analysis, 16, 81–92, 2003.
- Reykdal Ó., Jörundsdóttir H. Ó., Desnica N., Hauksdóttir S.,
Ragnarsdóttir Þ., Vrac A., Gunnlaugsdóttir H., Pálmadóttir H.:
Næringargildi sjávarafurða. Meginefni, steinefni, snefilefni og fitusýrur í lokaafurðum.
Skýrsla Matís 33-11, Október 2011.
ISSN 1670-7192
- Öhrvik V., von Malmborg A., Mattisson I., Wretling S., Åstrand
C.:
Fisk, skaldjur och fiskprodukter - analys av näringsämnen.
Rapport 1 - 2012.
Livsmedelsverket (National Food Agency), Sweden 2012.
ISSN 1104-7089
- Food Composition and Diet Team, Public Health Directorate:
Nutrient analysis of fish and fish products - Summary Report.
Department of Health, March 2013.
![]()
| ||
| ||
| ||
| ||
|
|
|
© 2025 Anders Møller, Danish Food Informatics | |
| The Compilers' Toolbox™ web site is provided and hosted by Danish Food Informatics. |