Estimating Component Values - Beef |
|
| | Updated 2020-07-19 |

| USDA regression analysis for beef data |
| USDA Ground Beef Calculator |
USDA Nutrient Data Laboratory launched some years ago a new nutrient search program,
the Ground Beef Calculator, which provides the user with nutrient information for retail
ground beef products containing any level of fat between 3% and 30%.
From the Ground Beef Calculator the relationship between content
of a component and the total lipid content can be estimated:
| |
Component |
Unit |
|
|
Regression equation |
Comment |
|
|
|
| |
Protein |
[g/100 g] |
= |
|
22.8 - 0.283 [g protein/g total lipids] * total lipids [g/100 g] |
|
|
|
| |
Fatty acids, total saturated |
[g/100 g] |
= |
|
0.2202 + 0.0.3765 [g FA/g total lipids] * total lipids [g/100 g] |
|
|
|
| |
Fatty acids, total monounsaturated |
[g/100 g] |
= |
|
-0.495 + 0.4783 [g FA/g total lipids] * total lipids [g/100 g] |
|
|
|
| |
Fatty acids, total polyunsaturated |
[g/100 g] |
= |
|
0.1691 + 0.0176 [g FA/g total lipids] * total lipids [g/100 g] |
|
|
|
| |
Fatty acids, total trans |
[g/100 g] |
= |
|
-0.100 + 0.064 [g FA/g total lipids] * total lipids [g/100 g] |
|
|
|
| |
Cholesterol |
[mg/100 g] |
= |
|
57.91 + 0.672 [mg cholesterol/g total lipids] *
total lipids [g/100 g] |
|
|
|
| |
Moisture |
[g/100 g] |
= |
|
77.0 - 0.758 [g moisture/g total lipids] * total lipids [g/100 g] |
|
|
|
| |
Ash |
[g/100 g] |
= |
|
1.11 - 0.0136 [g ash/g total lipids] * total lipids [g/100 g] |
|
|
|
|
| |
Vitamin C, total ascorbic acid |
[mg/100 g] |
= |
|
0 |
Assumed zero |
|
|
| |
Thiamin |
[mg/100 g] |
= |
|
0.0405 + 0.0001 [mg thiamin/g total lipids] * total lipids [g/100 g] |
|
|
|
| |
Riboflavin |
[mg/100 g] |
= |
|
0.151 |
Constant |
|
|
| |
Niacin |
[mg/100 g] |
= |
|
5.92 - 0.0845 [mg niacin/g total lipids] * total lipids [g/100 g] |
|
|
|
| |
Pantothenic acid |
[mg/100 g] |
= |
|
0.7037 - 0.0103 [mg pantothenic acid/g total lipids] * total lipids [g/100 g] |
|
|
|
| |
Vitamin B6 |
[mg/100 g] |
= |
|
0.4147 - 0.0046 [mg vitamin B6/g total lipids] * total lipids [g/100 g] |
|
|
|
| |
Folate, total |
[mg/100 g] |
= |
|
3.863 + 0.1663 [mg folate, total/g total lipids] * total lipids [g/100 g] |
|
|
|
| |
Choline, total |
[mg/100 g] |
= |
|
75.72 - 0.9642 [mg choline, total/g total lipids] * total lipids [g/100 g] |
|
|
|
| |
Vitamin B12 |
[ug/100 g] |
= |
|
2.283 - 0.007 [ug vitamin B12/g total lipids] * total lipids [g/100 g] |
|
|
|
|
| |
Vitamin A, RAE |
[ug/100 g] |
= |
|
4 |
Constant |
|
|
| |
Retinol |
[ug/100 g] |
= |
|
4 |
Constant |
|
|
| |
Vitamin E (alpha-tocopherol) |
[mg/100 g] |
= |
|
0.17 |
Constant |
|
|
| |
Tocopherol, beta |
[mg/100 g] |
= |
|
0 |
Assumed zero |
|
|
| |
Tocopherol, gamma |
[mg/100 g] |
= |
|
0 |
Assumed zero |
|
|
| |
Tocopherol, delta |
[mg/100 g] |
= |
|
0 |
Assumed zero |
|
|
| |
Vitamin D (D2 + D3) |
[ug/100 g] |
= |
|
0.06 |
Constant |
|
|
| |
Vitamin D3 (ergocalciferol) |
[ug/100 g] |
= |
|
0 |
Assumed zero |
|
|
| |
Vitamin D3 (cholecalciferol) |
[ug/100 g] |
= |
|
0.06 |
Constant |
|
|
| |
Vitamin K (phylloquinone) |
[ug/100 g] |
= |
|
-0.222 + 0.1024 [ug Vitamin K (phylloquinone)/g total lipids] * total lipids [g/100 g] |
|
|
|
|
| |
Sodium |
[mg/100 g] |
= |
|
66 |
Constant |
|
|
| |
Potassium |
[mg/100 g] |
= |
|
372.1 - 5.136 [mg potassium/g total lipids] * total lipids [g/100 g] |
|
|
|
| |
Calcium |
[mg/100 g] |
= |
|
6.09 + 0.596 [mg calcium/g total lipids] * total lipids [g/100 g] |
|
|
|
| |
Magnesium |
[mg/100 g] |
= |
|
23.1 - 0.314 [mg magnesium/g total lipids] * total lipids [g/100 g] |
|
|
|
| |
Phosphorous |
[mg/100 g] |
= |
|
211.2 - 2.643 [mg phosphorous/g total lipids] * total lipids [g/100 g] |
|
|
|
| |
Iron |
[mg/100 g] |
= |
|
2.53 - 0.0295 [mg iron/g total lipids] * total lipids [g/100 g] |
|
|
|
| |
Zinc |
[mg/100 g] |
= |
|
5.403 - 0.0611 [mg zinc/g total lipids] * total lipids [g/100 g] |
|
|
|
| |
Copper |
[mg/100 g] |
= |
|
0.0827 - 0.0011 [mg copper/g total lipids] * total lipids [g/100 g] |
|
|
|
| |
Manganese |
[mg/100 g] |
= |
|
0.0108 - 6E-05 [mg manganese/g total lipids] * total lipids [g/100 g] |
|
|
|
| |
Selenium |
[ug/100 g] |
= |
|
18.18 - 0.155 [ug selenium/g total lipids] * total lipids [g/100 g] |
|
|
|
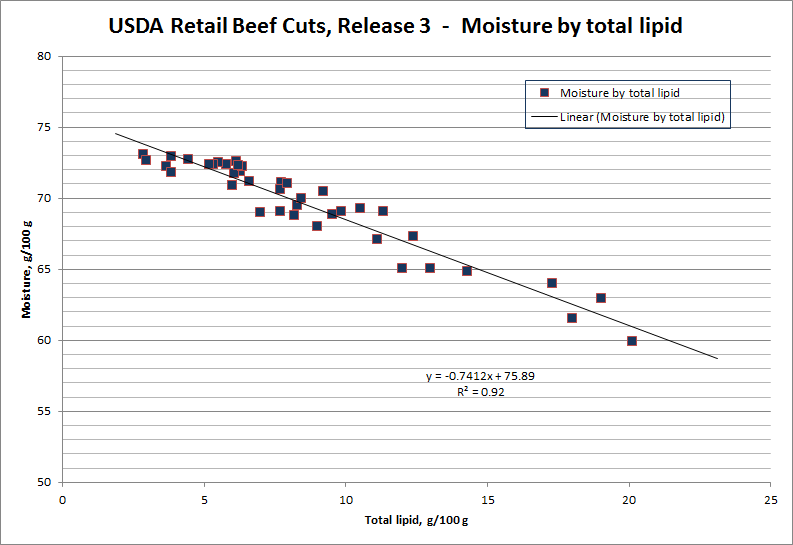
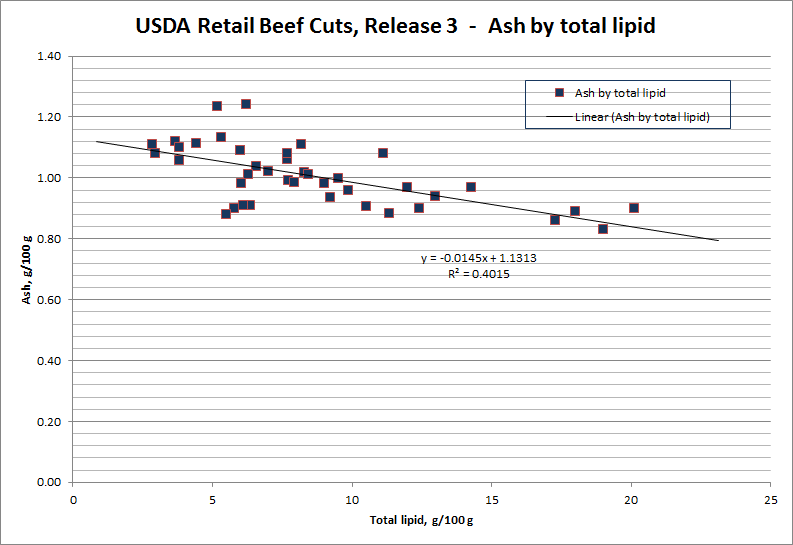
| USDA Retail Beef Cuts, Release 3 - linear regression results |
Roseland et al (2013) describe the collaborative study conducted to determine the mathematical
relationship between individual nutrients and fat content of raw retail beef cuts from which a regression analysis can be performed.
The data have been published in tables that provide nutrient profiles for raw and cooked beef cuts of varying fat content.
Using reverse engineering on these raw beef data, it is possible
to deduct the regression equations.
The following linear regression equations of the content of components by total lipid content have been deducted:
| |
Component |
Unit |
|
|
Regression equation |
R² |
|
|
|
| |
Moisture |
[g/100 g] |
= |
|
75.89 - 0.7412 [g moisture/g total lipids] * total lipids [g/100 g] |
0.92 |
|
|
| |
Cholesterol |
[mg/100 g] |
= |
|
56.084 + 1.1369 [mg cholesterol/g total lipids] *
total lipids [g/100 g] |
0.583 |
|
|
| |
Protein |
[g/100 g] |
= |
|
22.99 - 0.2472 [g protein/g total lipids] * total lipids [g/100 g] |
0.568 |
|
|
| |
Ash |
[g/100 g] |
= |
|
1.1313 - 0.0145 [g ash/g total lipids] * total lipids [g/100 g] |
0.402 |
|
|
|
| |
Thiamin |
[mg/100 g] |
= |
|
0.081 - 0.0008 [mg thiamin/g total lipids] * total lipids [g/100 g] |
0.0357 |
|
|
| |
Riboflavin |
[mg/100 g] |
= |
|
0.247 - 0.0007 [mg riboflavin/g total lipids] * total lipids [g/100 g] |
0.2215 |
|
|
| |
Niacin |
[mg/100 g] |
= |
|
5.9967 - 0.0706 [mg niacin/g total lipids] * total lipids [g/100 g] |
0.0666 |
|
|
| |
Pantothenic acid |
[mg/100 g] |
= |
|
0.63 - 0.0003 [mg pantothenic acid/g total lipids] * total lipids [g/100 g] |
4E-05 |
|
|
| |
Vitamin B6 |
[mg/100 g] |
= |
|
0.7063 - 0.009685 [mg vitamin B6/g total lipids] * total lipids [g/100 g] |
0.3044 |
|
|
| |
Vitamin B12 |
[ug/100 g] |
= |
|
0.6626 - 0.0135 [ug vitamin B12/g total lipids] * total lipids [g/100 g] |
0.046 |
|
|
|
| |
Sodium |
[mg/100 g] |
= |
|
59.34 + 0.1776 [mg sodium/g total lipids] * total lipids [g/100 g] |
0.0034 |
|
|
| |
Potassium |
[mg/100 g] |
= |
|
355.98 - 4.0198 [mg potassium/g total lipids] * total lipids [g/100 g] |
0.2839 |
|
|
| |
Calcium |
[mg/100 g] |
= |
|
10.26 + 0.4669 [mg calcium/g total lipids] * total lipids [g/100 g] |
0.0907 |
|
|
| |
Magnesium |
[mg/100 g] |
= |
|
19.91 - 0.63 [mg magnesium/g total lipids] * total lipids [g/100 g] |
0.003 |
|
|
| |
Phosphorous |
[mg/100 g] |
= |
|
232.8 - 3.624 [mg phosphorous/g total lipids] * total lipids [g/100 g] |
0.7324 |
|
|
| |
Iron |
[mg/100 g] |
= |
|
2.317 + 0.0318 [mg iron/g total lipids] * total lipids [g/100 g] |
0.0971 |
|
|
| |
Zinc |
[mg/100 g] |
= |
|
4.498 - 0.0325 [mg zinc/g total lipids] * total lipids [g/100 g] |
0.0073 |
|
|
| |
Selenium |
[ug/100 g] |
= |
|
27.25 - 0.3647 [ug selenium/g total lipids] * total lipids [g/100 g] |
0.1611 |
|
|
Some examples of visual depiction of the regression equations found
from the raw beef data described above:
- United States Department of Agriculture - Agricultural Research Service:
Ground Beef Calculator.
https://www.ars.usda.gov/northeast-area/beltsville-md-bhnrc/beltsville-human-nutrition-research-center/methods-and-application-of-food-composition-laboratory/mafcl-site-pages/beef-calculator/ (accessed
2020-07-19).
- Patterson K. Y., Duvall M. L., Bhagwat S., Howe J. C., Holden J.
M. (2011):
USDA Nutrient Data Set for Retail Beef Cuts Release 2.0.
Nutrient Data Laboratory (NDL), Agricultural Research Service, U.S.
Department of Agriculture, September 2011.

- Kehlet U., Darré M.T., Jensen K., Madsen N.T. and Kristensen L.
(2012):
Nutritional composition of Danish Beef.
58th International Congress of Meat Science and Technology, 12-17th
August 2012, Montreal, Canada.
- Roseland J., Nguyen Q. V., Williams J. R., Patterson K.
Y. (2013):
USDA Nutrient Data Set for Retail Beef Cuts Release 3.0.
Nutrient Data Laboratory (NDL), Agricultural Research Service, U.S.
Department of Agriculture, September 2013.
