| - provided by Danish Food Informatics |
Estimating Component Values - Pork | |
| Updated 2019-11-22 | |
| Pork on the Danish Market 2015 |
![]()
In 2015, DTU National Food Institute carried out a project in collaboration with The Danish National Food Agency. The aim of the project was to investigate whether the data for pork from the 1990s was consistent with pork available on the Danish market in 2015, and to provide information on the nutrient content of the new types of pork cuts. Within the financial framework for the project, conventionally produced Danish pork was prioritized as it constitutes approximately 90% of fresh pork bought by Danish households.
A conventionally farmed Danish pig is a very consistent product. Particularly the percentage of lean meat will determine whether the pork cuts are sold on the domestic or the export market. The sampling criteria were set to reflect an average Danish pig on the Danish market.
The ten pigs sampled for the project contained 59.8-60.7% of lean meat. A total of 12 different cuts were analyzed: pork loin trimmed to 1 and 3 mm fat, pork loin with rind, tenderloin, neck fillet, pork belly, pork cheek, and 5 different cuts of ham trimmed for fat at different levels. The analytical program included fat and fatty acids, nitrogen, dry matter, ash, cholesterol, vitamins (A, D, E, B1, B2, B6, B12, niacin, pantothenic acid, biotin), minerals (sodium, potassium, calcium, magnesium, phosphorous, iron, zinc, manganese) and elements (chromium, selenium, nickel). The results support the assertion that no change has occurred in Danish pig breeding, which has influenced the content of macro- and micronutrients in the period from 1993 to 2015.
The study also shows there has been a move towards pork cuts being trimmed for fat at different levels. Completely trimmed tenderloin without chain muscle has a lower fat content than tenderloin sold as trimmed. Thus, the trimming that occurs before cooking has a significant impact on the content of fat, while trimming has less of an impact on the content of protein. Trimming changes the content of fat from 22 g/100 g to 10 g/100 g to 4 g/100 g respectively for a pork loin with rind, a pork loin with a 3mm fat edge, or a pork loin with a 0-1 mm fat edge. For protein the content changes from 18.5 g/100g, 20.8 g/100 g and 22.6 g/100 g in the same cuts.
| The Danish Pork Data |
![]()
The project report contains results of the proximate analyses for 82 samples (22 different pork cuts), which makes it possible to investigate eventual dependencies between the components analysed.
The proximates have been analysed in all 82 samples, but unfortunately, in the samples analysed for vitamins and minerals only total lipid was analysed in 12 samples. Therefore, the statistical analyses of vitamins' and minerals' dependencies with proximate content is somewhat weaker for protein and dry matter.
| Results of statistical analyses of proximate components |
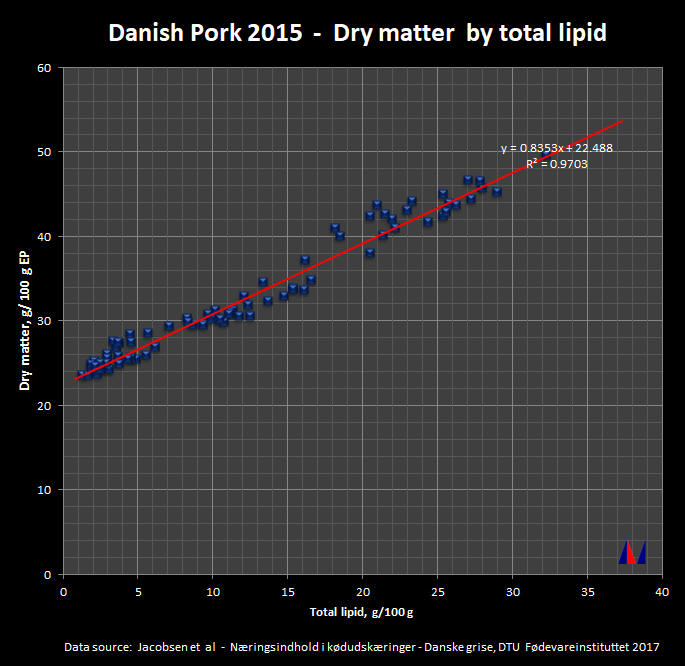
| Dry Matter by Total Lipid |
Naturally, one could say, dry matter shows an almost perfect dependency of total lipid. In addition, the "about 80"-rule (sum of total lipid and moisture is a little above 80%).
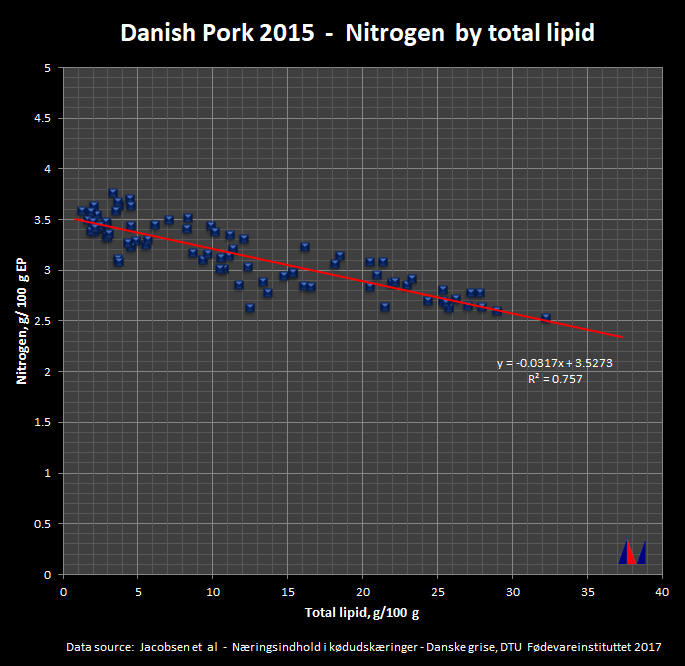
| Nitrogen by Total Lipid |
Similar to dry matter by total lipid, nitrogen by total lipid shows a linear dependency of total lipid, but less outspoken.
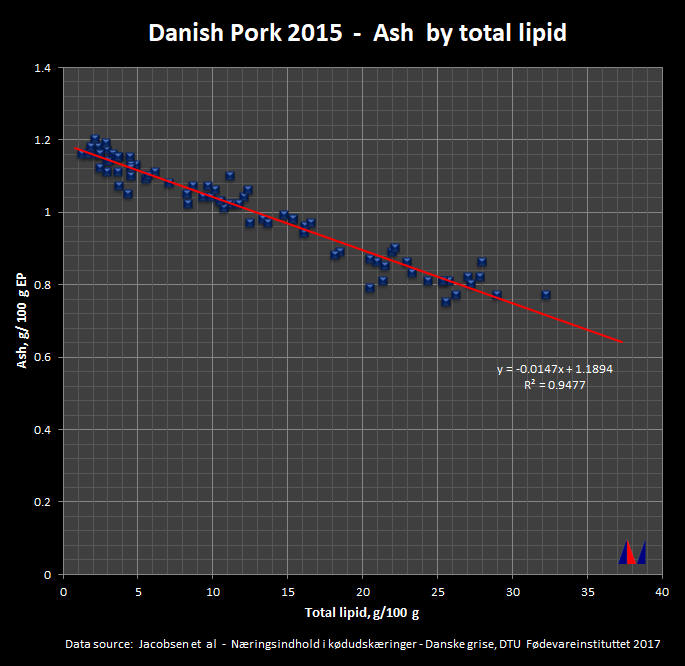
| Ash by Total lipid |
Similar to dry matter by total lipid and nitrogen by total lipid, ask by total lipid shows - as expected - a nice linear dependency of total lipid.
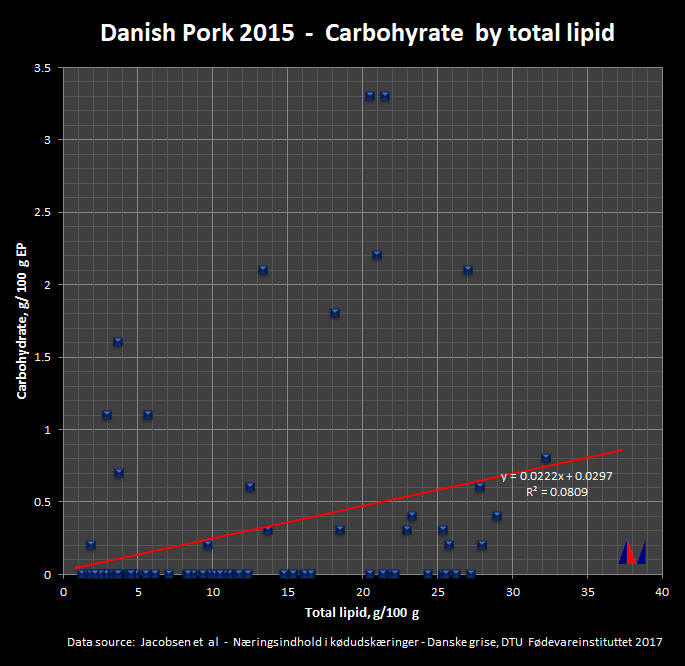
| Carbohydrate by Total Lipid |
As Meinert et al. clearly showed, there are small amounts of carbohydrate in pork. In this study, however, the carbohydrate values are extremely uncertain due to the method, carbohydrate by difference, used to obtain the carbohydrate values.
Not only do the calculated carbohydrate values include all the
uncertainties of the determination of nitrogen, total lipid, ash and
dry matter, in addtion the values of protein (nitrogen x 6.25) and
total lipid may be just a little overestimated by the used
analytical/calculation methods.
The values are presented here just as an indication of a possible
(small) carbohydrate content. The linear relationship between
carbohydrate and total lipid is here so bad that it should actually
not be shown.
| Results for statistical analyses of fatty acid sums and cholesterol against total lipid content |
| Fatty acid sums by Total Lipid |
The fatty acid sums from the analysis in the Dansh Pork 2015 project shows a completely linear dependency of the total lipid content in the samples as it should. The lipid conversion factor for the pork cuts in this study can be read from the slope of the Total FA line, here 0.944 g FA/g total lipid. However, the intercept os not complete zero (0,0). Forcing the intercept to zero (0,0), the slope of the linear regression line will be slightly lower: 0.928 g FA/100 g total lipid. This is value lies between the theoretical values of 0.91 (lean pork meat) and 0.953 (pork adipose tissue) listed by B. A Anderson (JADA 1976) and may be used as an average lipid acid conversion factor for Danish pork.
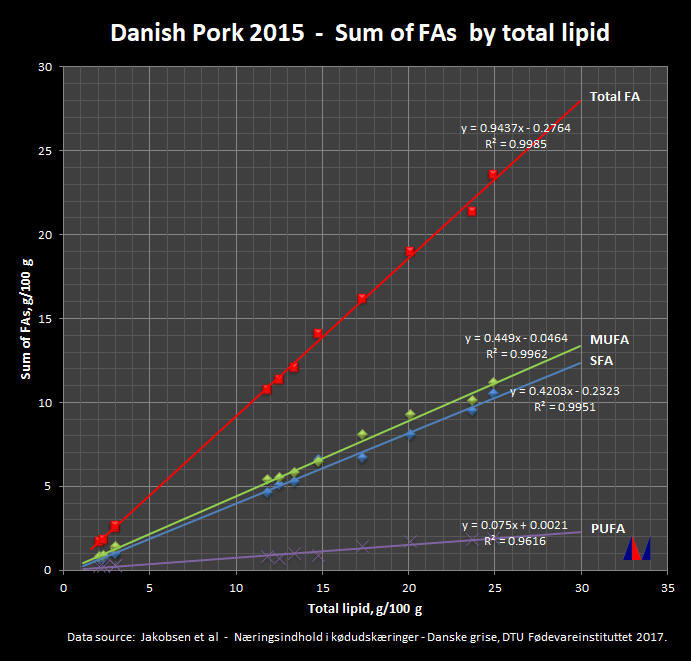
As indicated by B. A. Anderson, the lipid conversion factor is not constant, which can also be seen from the Danish data. From the Danish data it seems like the lipid conversion factor is lower for cuts with a low content og total lipid and higher for the more fatty meat:
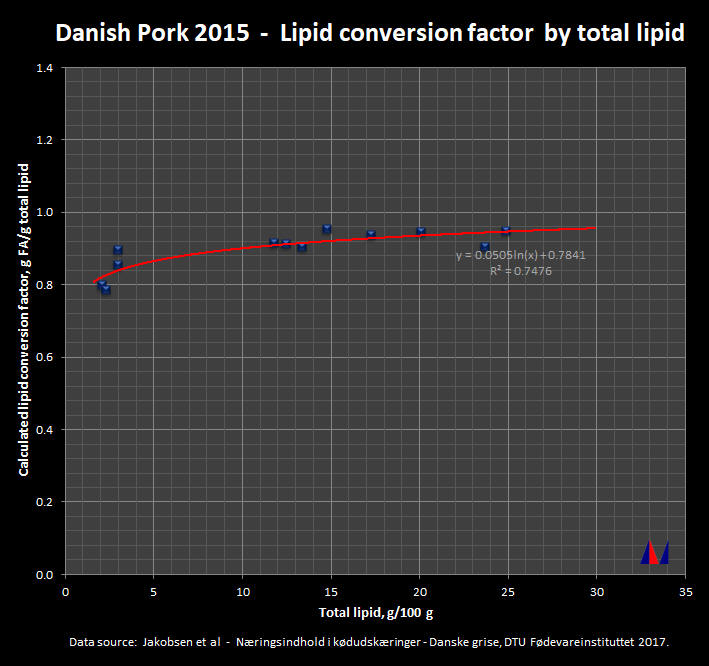
The small increase in the calculated lipid conversion factor is most marked in the range below 5 to 10% total lipid indicated by the red line, which is only shown to indicate the trend - it is not an exact indicator.
The calculations presented above does not include contributions from the trans fatty acid C18:1 tr. Including the trans fatty acid in the calculation will not raise the average lipid conversion factor significantly, because the content of C18:1 tr is relatively small (0.005 to 0.06 g/100 g EP dependent on total lipid content) in comparison to the other fatty acids.
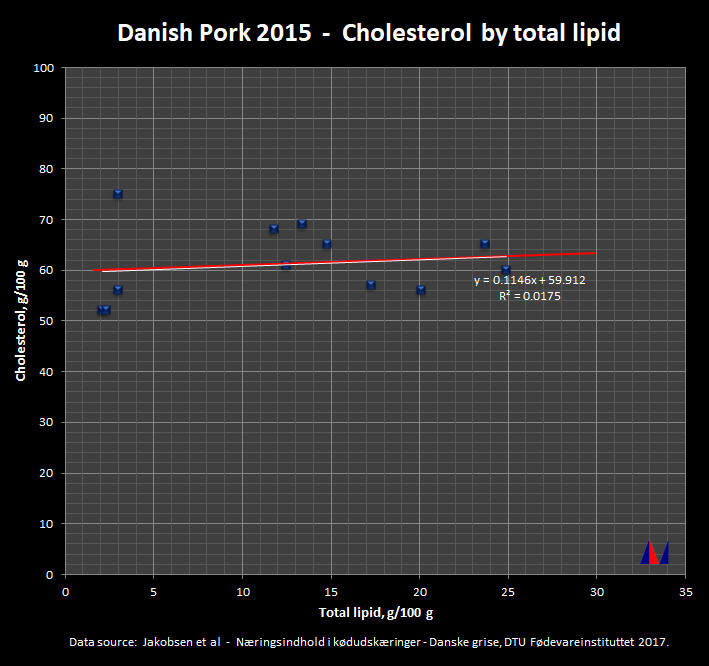
| Cholesterol by Total Lipid |
In this study cholesterol shows no (or very little) dependency on the total lipid content of the pork cut samples. The average choleserol content in Danish pork is about 61 mg/ 100 g EP with a relatively large range from 52 to 75 mg/100 g EP.
Interstingly, the cholesterol content does not seem to change much
with time, which is also one of the study's conclusions. The white
line in the diagram shows the cholesterol content calculated with
the formula deducted from USDA and British data for the Danish food
composition table more than three decades ago. The old cholestrol
estimation procedure includes both total lipid and protein, see the
explanations from previsous version of the Danish Food Composition Database
![]() .
The similarity is striking.
.
The similarity is striking.
| Results of statistical analyses of vitamins against total lipid content (currently uncommented) |
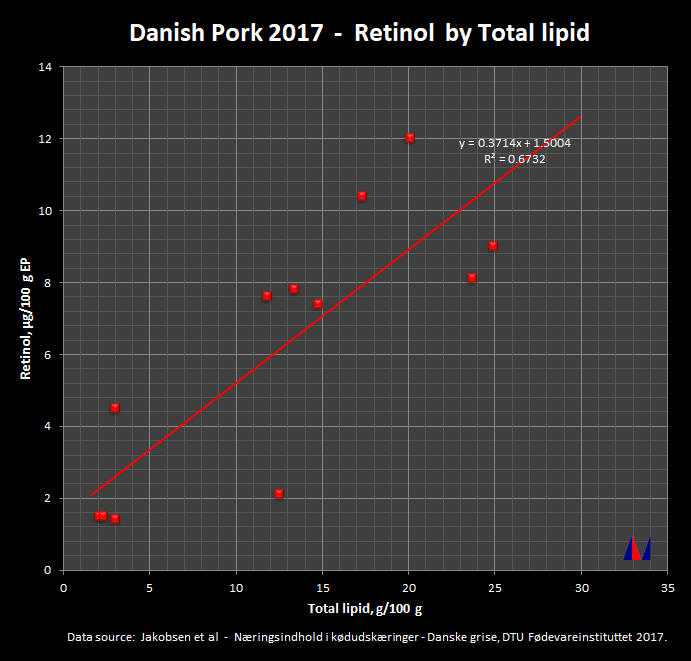
| Retinol by Total Lipid |
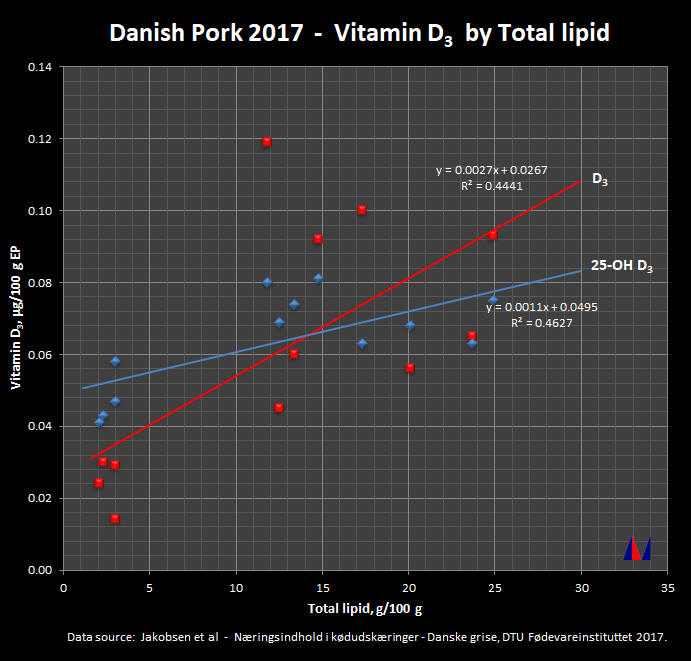
| Vitamin D3 (cholecalciferol) and 25-OH Vitamin D (25-OH cholecalciferol) by Total Lipid |
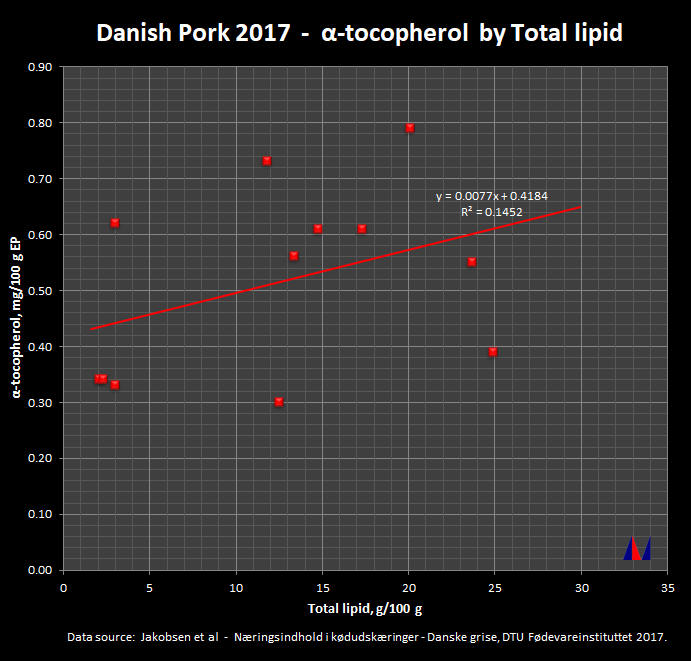
| α-Tocopherol by Total Lipid |
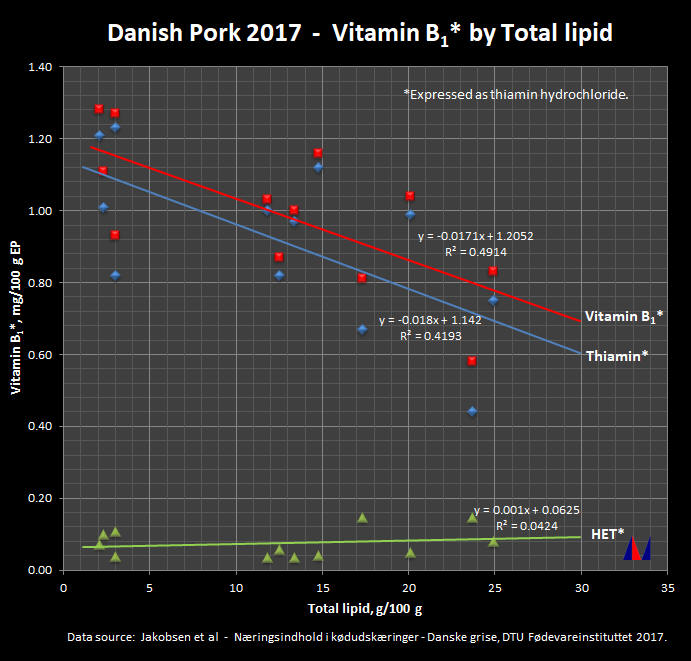
| Vitamin B1 by Total Lipid |
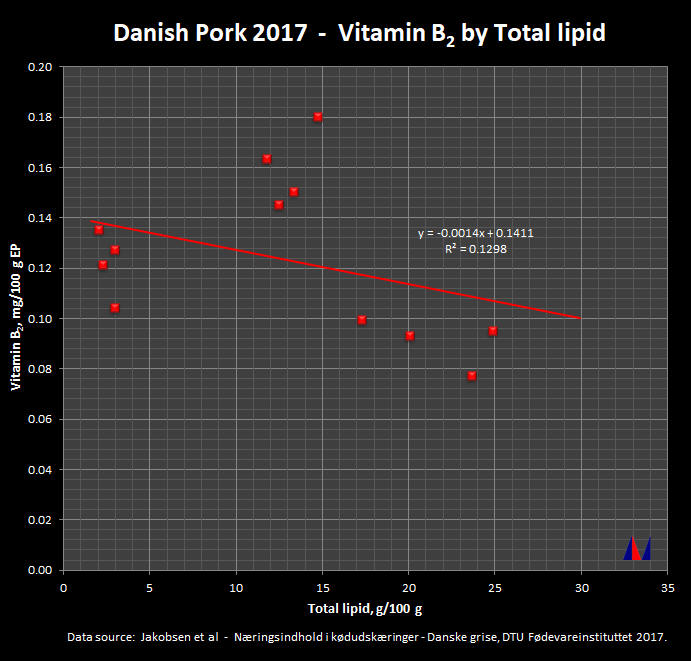
| Vitamin B2 by Total Lipid |
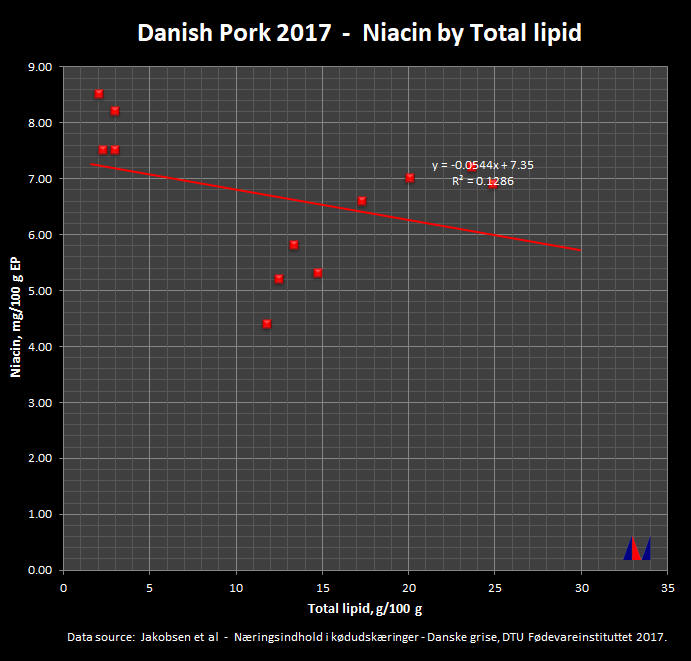
| Niacin by Total Lipid |
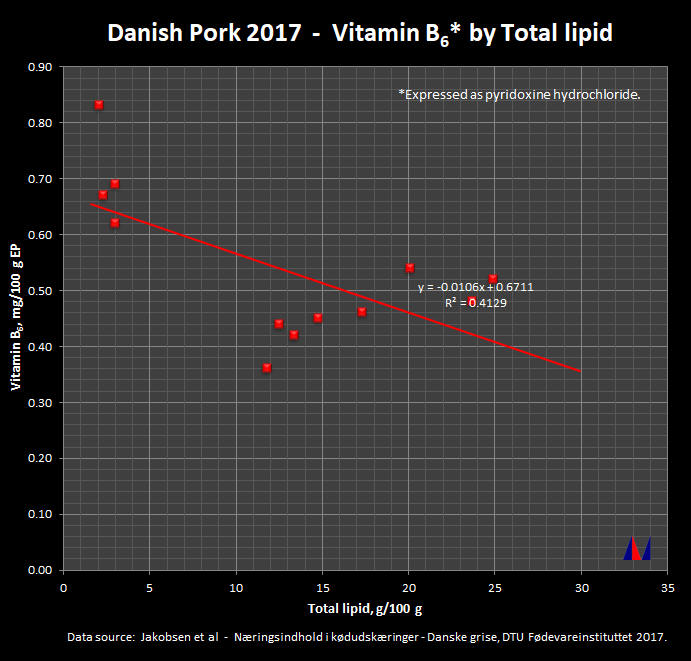
| Vitamin B6 by Total Lipid |
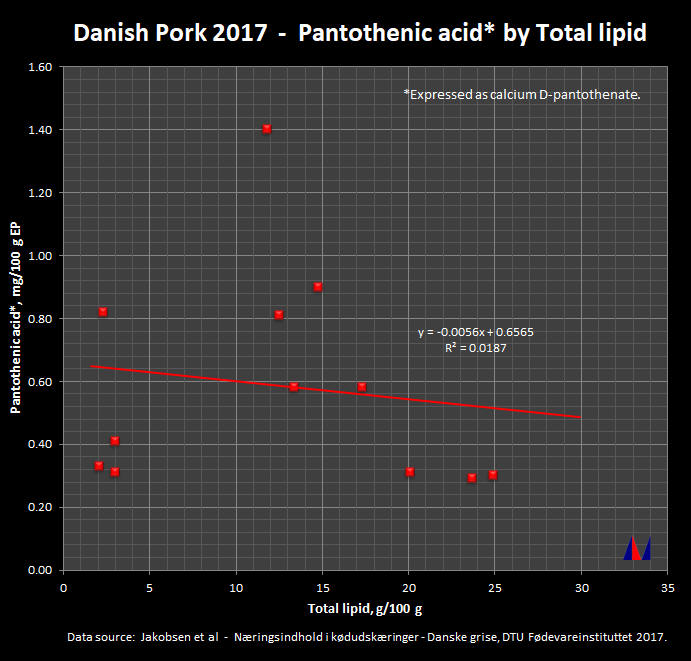
| Pantothenic acid by Total Lipid |
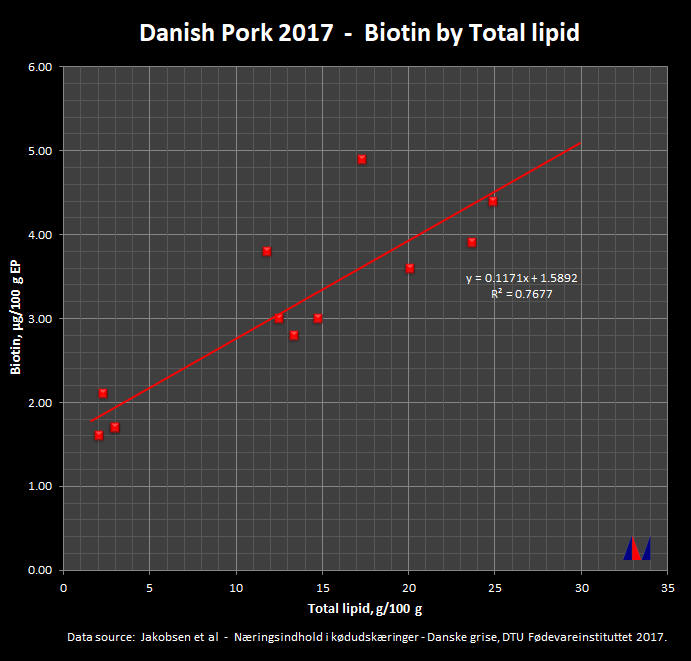
| Biotin by Total Lipid |
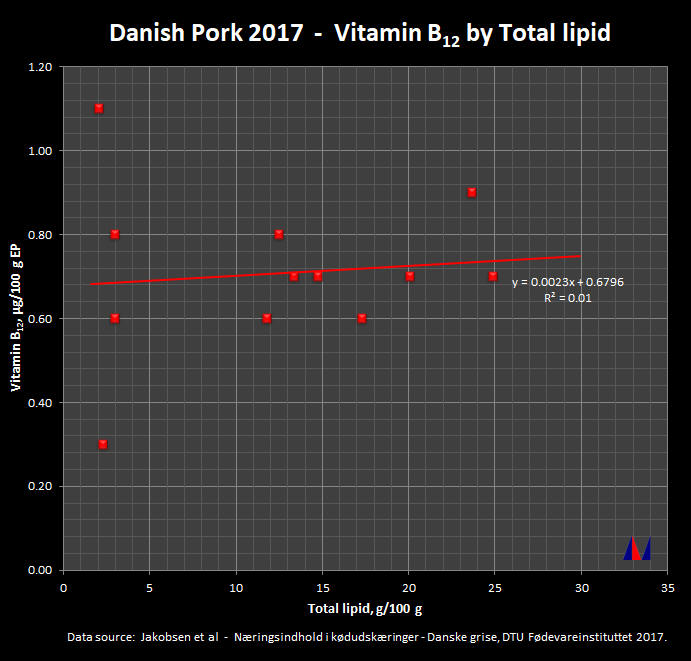
| Vitamin B12 by Total Lipid |
| Results of statistical analyses of minerals against total lipid content (currently uncommented) |
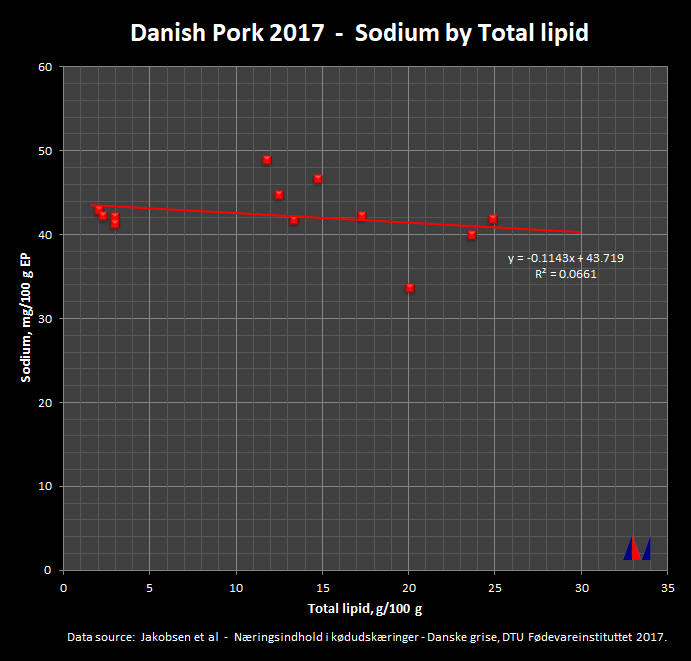
| Sodium by Total Lipid |
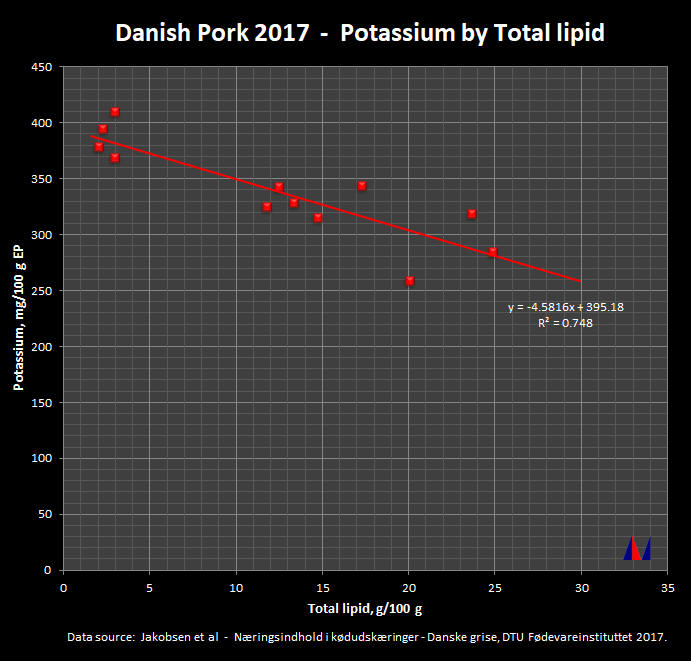
| Potassium by Total Lipid |
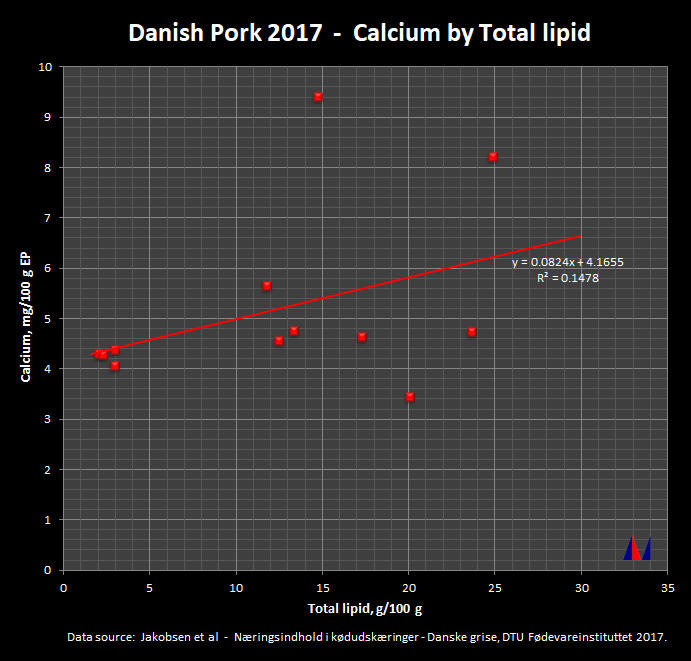
| Calcium by Total Lipid |
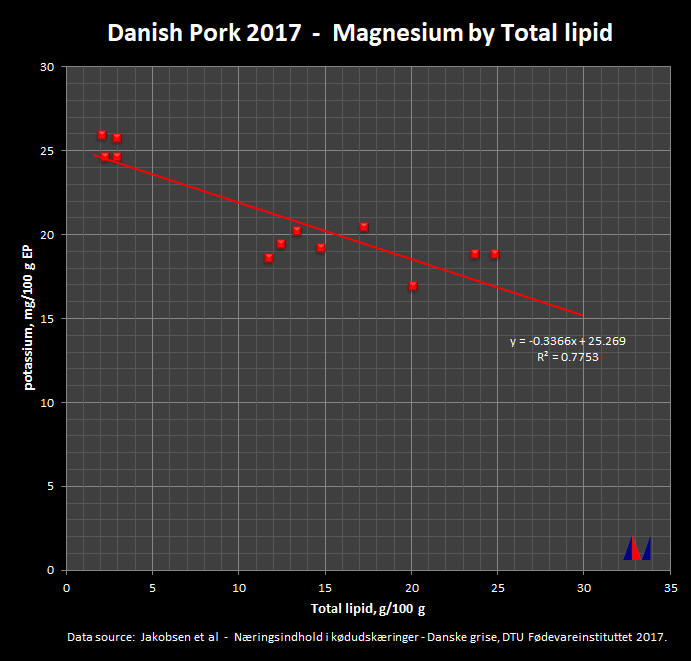
| Magnesium by Total Lipid |
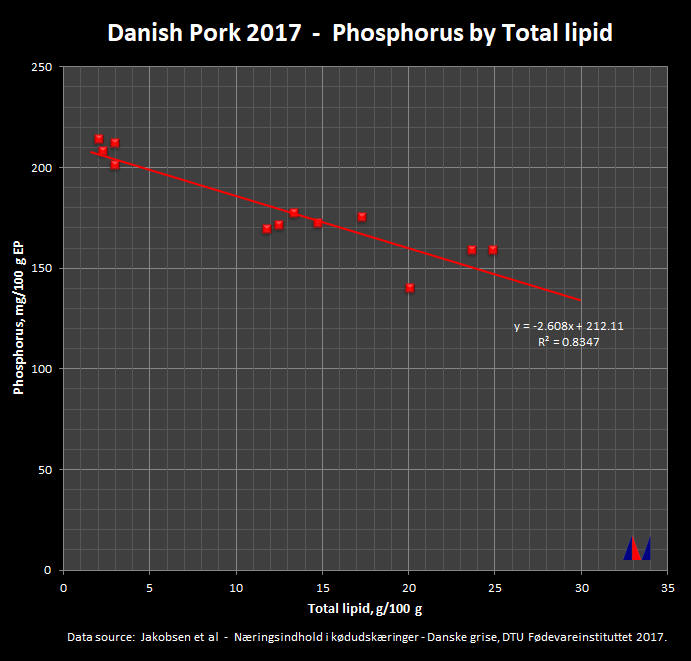
| Phosphorus by Total Lipid |
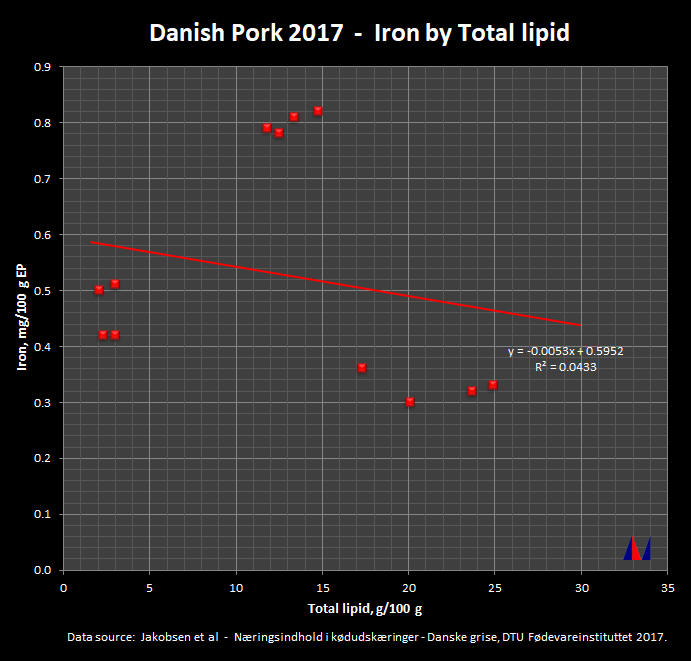
| Iron by Total Lipid |
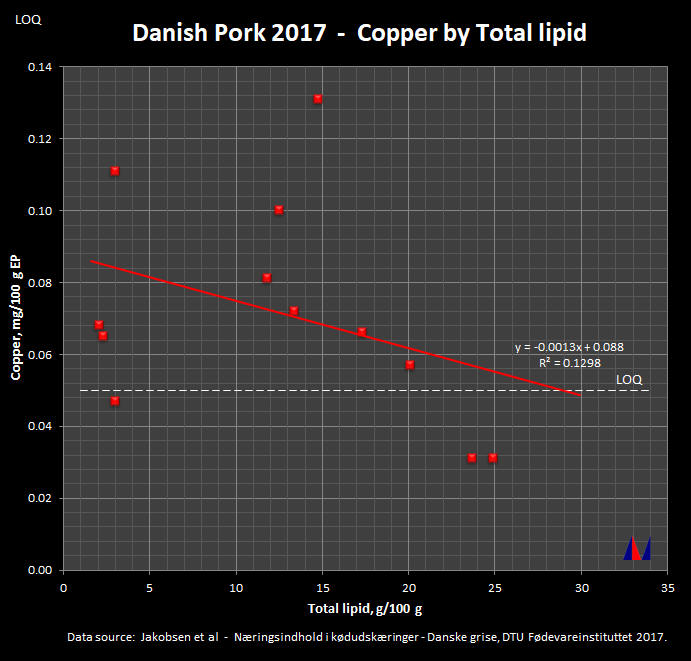
| by Total Lipid |
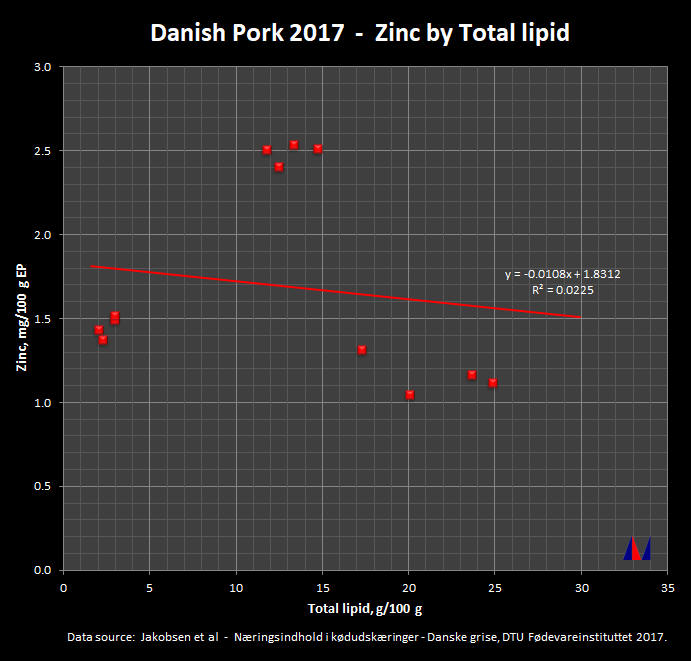
| Zinc by Total Lipid |
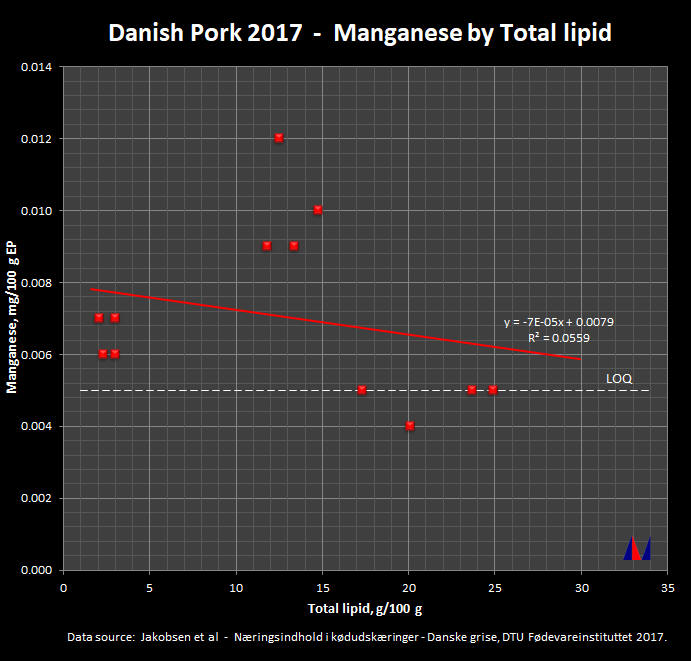
| Manganese by Total Lipid |
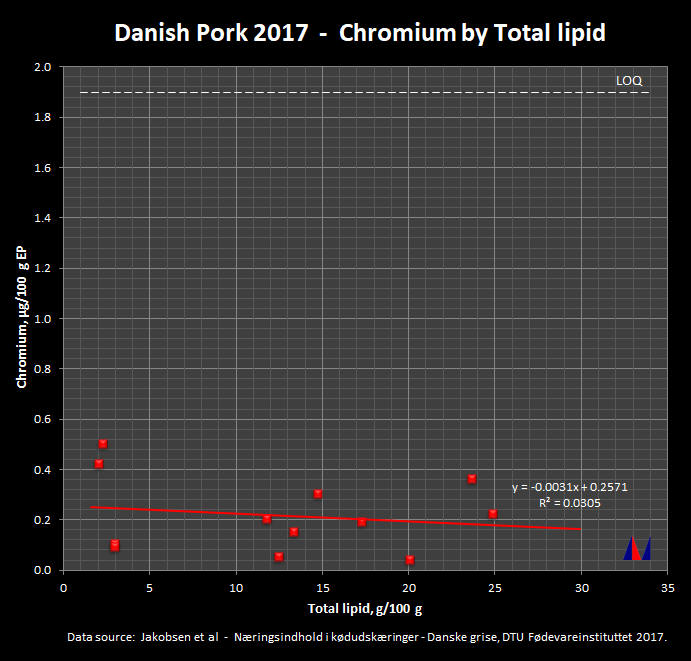
| Chromium by Total Lipid |
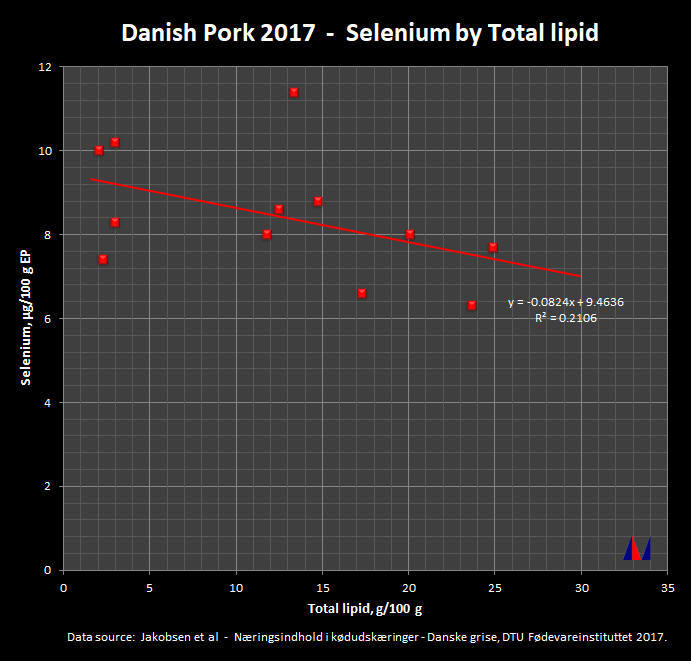
| Selenium by Total Lipid |
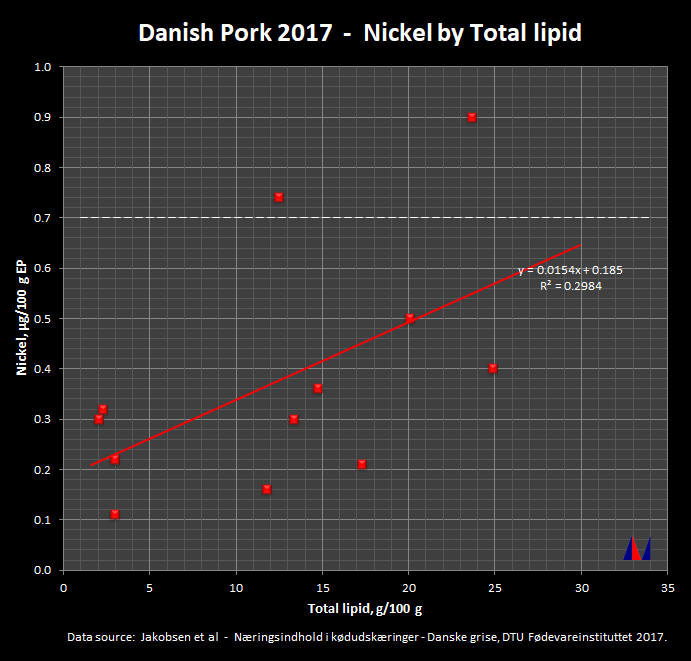
| Nickel by Total Lipid |
| References |
![]()
- Jette Jakobsen, Aase Ærendahl Mikkelsen, Anette Bysted, Pia Knuthsen (2017):
Næringsindhold i kødudskæringer – Danske grise [Nutrient content in meat cuts - Danish pigs].
DTU Fødevareinstituttet, Danmarks Tekniske Universitet - Februar 2017. ISBN: 978-87-93109-99-5

- Meinert L., Schäfer A., Bjergegaard C., Aaslyng M.D., Bredie
W.L.P. (2009):
Comparison of glucose, glucose 6-phosphate, ribose, and mannose as flavour precursors in pork; the effect of monosaccharide addition on flavour generation.
Meat Science 81, 419–425. [doi:10.1016/j.meatsci.2008.08.018]
![]()
| ||
| ||
| ||
| ||
|
|
|
© 2025 Anders Møller, Danish Food Informatics | |
| The Compilers' Toolbox™ web site is provided and hosted by Danish Food Informatics. |