| - provided by Danish Food Informatics |
Method | |
| Updated 2022-04-19 | |
| Method - expression of analytical results |
![]()
The expression of analytical results and calculated values may
depend on several issues. It is well known that food composition
data usually are expressed per 100 g - contradictory to the Système
International (SI system) where it would be more appropriate to
express values per kilo (kg). There has been a few attempts to do
so, e.g. the Swedish 1978 food composition table, but the nutrition
community did not receive this well.
Likewise, the use of kilocalories (kcal) as energy unit is still
widely appearing despite the fact that the unit was internationally
discarded more that 40 years ago in preference of the Joule (kJ) in
the SI system.
Other expressions that may cause confusion is the "equivalent" expressions, like the expressions used for for vitamin A activity (RE, RAE, etc.), niacin equivalents, expression of vitamin A and D in international units, fatty acids expressed per 100 g FA - is it really FA (fatty acids) or FAME (fatty acid methyl esters)? - amino acids expressed per 100 g, per g N or per 16 g N, etc.
In addition, there are methodologically different expressions for a range of components. Regulations or analytical method specifications/standards may even prescribe different expressions - even for the same component.
A few examples of different expressions for the same component
are
Protein
The recommended method (FAO 2003) for protein
determination is "the sum of amino acid residues" (see
also
Protein). The acceptable method of protein
determination is the most commonly
used calculation of the
so-called "crude protein" from the amount of total nitrogen (N) analysed in the food by the Kjeldahl or comparable method (Dumas,
Kjel-Foss (automated Kjeldahl using antimony-based catalyst), Kjeltec, etc).
By multiplying the total nitrogen content with a food matrix specific factor, the nitrogen-to-protein conversion factor (NCF) or Jones' factor:
| protein content = | total nitrogen content x specific conversion factor |
the "crude protein" content is found.
The total nitrogen determined by Kjeldahl methods contains a proportion of non-protein nitrogen (NPN), like free amino acids, urea, ammonia compounds, nitrate/nitrate, etc.. If the amount of non-protein nitrogen is determined, the amount of "true" protein can be calculated
| protein content = | (total nitrogen content - non-protein nitrogen) x specific conversion factor |
This means that we actually have (at least) three different ways of expressing the amount of protein in a food.
Furthermore, the total nitrogen content measured with different
analytical methods, give similar, but not same results.
Furthermore, differences are dependent of the food matrices. As an
example, the AOAC Official Method 992.15 Crude Protein in Meat and
Meat Products Including Pet Foods, Combustion Method, First Action
1992, mentions in a foot note that "Results using this
method average 1.01 * results using 928.08" (928.08 being the
AOAC "standard" Kjeldahl method) - this means that the nitrogen
content measured with the newer combustion method is higher than the
nitrogen content measured with the traditional Kjeldahl method.
Total lipid/total fat
The recommended method (FAO 2003) for
determination of (total) lipid/fat is as "fatty acids and expressed
as triglycerides, as this approach excludes wax esters and the
phosphate content of phospholipids"; this definition imply the use
of gas chromatographic methods.
The acceptable
methods are the traditional gravimetric methods involving extraction
with one or more solvents, but the different methods yield different
results (see also
Lipids).
Fatty acids
Errors concerning fatty acid values often occur because it is not
clear on which basis the fatty acid values are given. Values for
fatty acids in profiles are usually given as % of total fatty acids
(or g/100 g total FA). There is an ambiguity build into this
expression, because "total fatty acids" can mean (at least) two
things
- the "sum of the known fatty
acids", i.e. the sum of only fatty acids identified during the
fatty acid analysis;
- the "sum of known and unknown fatty acids", i.e. the sum of both identified and unidentified fatty acids.
Unidentified fatty acids are commonly designated as a value
named "unknown" or "unidentified" when figures are given. The amount of unknown
FAs can easily be 10-20% of the total of known and unknown fatty
acids.
Therefore, the expression where only known FAs are included in the
sum leads to a (gross) overestimation of the content of the fatty
acid contents and this expression should be avoided.
Thiamin
In thiamin analysis, the standard analytical methods, e.g.
AOAC 942.23, 953.17, 957.17, 986.27 and EN 14122, use
thiamine chloride hydrochloride (AOAC. thiamine-HCl) as standard
solution. The analytical results are expressed as thiamine chloride
hydrochloride (thiamine-HCl), accordingly.
However, the EN 14122 standard opens up for recalculation of the
analytical results as follows:

This means that thiamin can also be expressed as thiamin (1+) ion and thiamin chloride, which will evidently give different values for the nutrient, depending on the expression.
Newer HPLC methods using post-column derivatisation also detect content of
2-(1-hydroxyethyl)thiamine (HET) (mw: 381.33), which has
the same thiamine activity as thiamine. HET gives a significant
contribution to the total vitamin B1 activity.
Therefore, vitamin B1 should be expressed as
Vitamin B1 = thiamine + 2-(1-hydroxyethyl)thiamine
When vitamin B1 is expressed as thiamin
chloride hydrochloride (mw: 337.28), HET is added to the
determined thiamine content after multiplication with
(337.28/381.33).
Investigations have shown that 7-24% of thiamin detected in samples
of animal origin derives from HET. Similarly, HET contributed to 37%
of the total amount of vitamin B1 in dried yeast (Jakobsen,
2008).
Pantothenic acid
Customarily, the reference standard in pantothenic acid analysis is
calcium D-pantothenate, and the most common ways of expressing pantothenic acid are
either as D-pantothenic acid (molecular mass 219.237) or as calcium D-pantothenate
(476.536).
However, older official methods, e.g. AOAC 945.74, also indicate the
possibility of expressing the pantothenic acid potency as sodium
pantothenate (molecular mass 241.219).
Due to the difference in molecular mass of the three compounds, there will be
a difference in the value determined depending on the chosen
expression.
To calculate from D-pantothenic acid to calcium D-pantothenate use a
factor 1.087. Similarly, to calculate from calcium D-pantothenate to
D-pantothenic acid use a factor 0.920.
To calculate from D-pantothenic acid to sodium pantethonate use a
factor 1.100. Similarly, to calculate from sodium pantothenate to
D-pantothenic acid use factor 0.909.
Vitamin B6
The term vitamin B6 refers to a series of components, mainly pyridoxine
(pyridoxol), pyridoxal and pyridoxamine, chemically slightly different
forms of the vitamin. Vitamin B6 occurs in foods as
pyridoxin, pyridoxal and pyridoxamine, and may be present in both
the free for or a chemically bound state, e.g. as phosphates and
glucosides. Hence, the extraction of
the chemically bound forms is extremely important and usually
involves enzymes or hydrolysation (heating with acids).
After releasing the bound state of the vitamin, its components are
separated chromatographically and more recently by HPLC, followed by
determination of the vitamin B6 fractions either
microbiologically (microbiological assay) or by HPLC.
The standard solutions used in the microbiological assay are pyridoxine-HCl, pyridoxal-HCl, pyridoxamine-HCl.
This gives rise to different ways of expressing values for vitamin B6,
the hydrochloride expression and the free base expression. As the
molecular weights of pyridoxine, pyridoxal and pyridoxamines are 82,
82 and 70 percent of the weight of the hydrochlorides, there is good
reason to be alert. Failure to account for this difference leads
to serious errors in the interpretation of the final vitamin B6
content.
It is therefore important to determine if values are designated as
hydrochloride or free-base components.
Vitamin C
Be aware that older vitamin C methods determine acsorbic acid
only. The preferred methhods shall determine both acsorbic acid and
dehydroascorbic. Vitamin C is the sum of ascorbic acid and
dehydroascorbic acid.
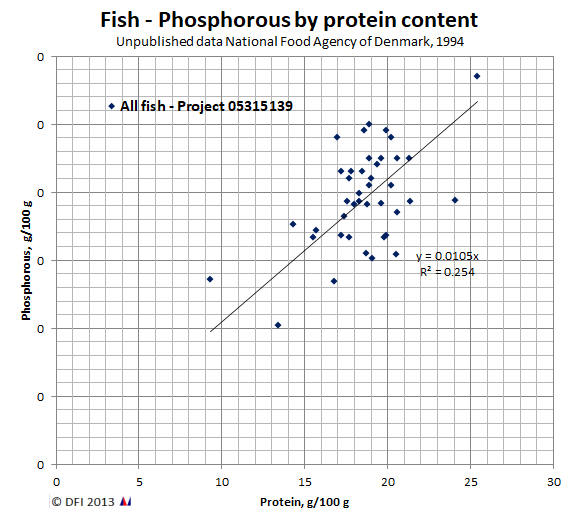
Phosphorus
Another example with different expressions for the same
component is Phosphorus. Phosphorus can be expressed as the element P, the normal
component used in food composition. However, phosphorus is in food
inspection and legal documents often expressed as phosphorus
pentoxide, P2O5 and analysed as such.
To recalculate results given as P2O5 to P,
multiply by
a factor of 0.437.
In Danish food inspection the following formula has been used to determine the natural content of Phosphorous in fish:
| % Phosphorous = | 0.0106 * % protein |
This formula is derived from a "linear" relationship between protein and Phosphorous in fish similar to the one shown below:
Elements - especially with regard to Selenium, Iodine,
Sodium and Chloride
The analytical values for some elements, in particular
Selenium, Iodine, Sodium and Chloride may vary between wet and dry
ashing because of their volatility.
In addition, the Selenium values can be affected by the completeness
of its reduction or oxidation.
| References |
![]()
- AOAC Official Method 928.08:
Nitrogen in Meat
Kjeldahl Method, First Action 1928, Final Action 1974.
- Food energy - methods of analysis and conversion factors.
Report of a technical workshop, Rome, 3-6 December 2002.
FAO Food and Nutrition Paper 77.
Food and Agriculture Organization of the United Nations, Rome, 2003.
- Martha Louise Orr:
Pantothenic acid, Vitamin B6, Vitamin B12.
Home Economics Research Report No. 36.
Agricultural Research Service, U.S. Department of Agriculture, Washington, August 1969.
- Jette Jakobsen:
Optimisation of the determination of thiamin, 2-(1-hydroxyethyl)thiamin, and riboflavin in food samples by use of HPLC.
Food Chemistry 106(3):1209-1217, February 2008.
DOI: 10.1016/j.foodchem.2007.06.008
- Peter Molander:
Phosphat i ferske og frosne fisk og fiskerivarer [Phosphates in fresh and frozen seafood].
Projekt 2009-20-64-00163 - Fødevarestyrelsen, Øst, November 2011.
![]()
| ||
| ||
| ||
| ||
|
|
|
© 2025 Anders Møller, Danish Food Informatics | |
| The Compilers' Toolbox™ web site is provided and hosted by Danish Food Informatics. |